
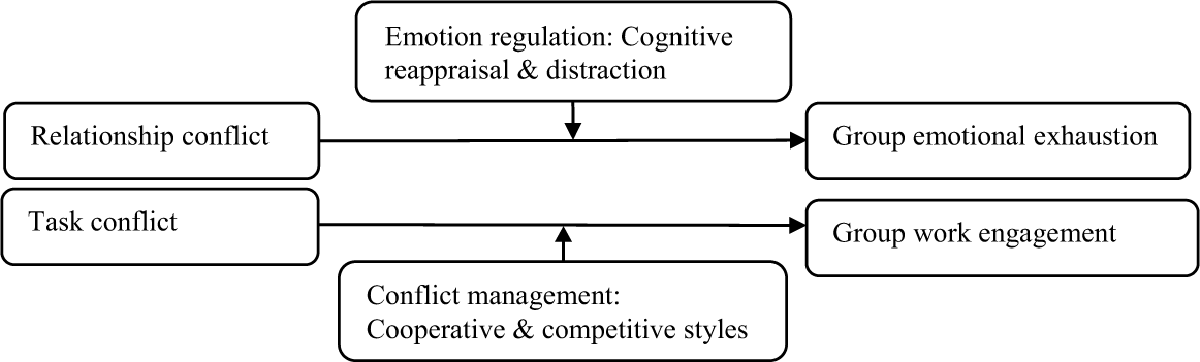
Figure 1
A graphical summary of the study design.
Table 1
rwg and ICC indices for justifying aggregation.
| Variables | rwg | ICC (1) |
|---|---|---|
| Relationship conflict | 0.74 | 0.13 |
| Task conflict | 0.80 | 0.14 |
| Emotional exhaustion | 0.92 | 0.64 |
| Work engagement | 0.90 | 0.26 |
Table 2
Mean (M), Standard deviation (SD) and inter-correlations of the study variables.
| Variables | M | SD | 1 | 2 | 3 | 4 | 5 | 6 | 7 | 8 |
|---|---|---|---|---|---|---|---|---|---|---|
| 1. Relationship conflict | 4.18 | 0.68 | 0.82 | |||||||
| 2. Emotional exhaustion | 4.63 | 0.70 | 0.37*** | 0.89 | ||||||
| 3. Cognitive reappraisal | 5.21 | 0.84 | –0.16 | –0.04 | 0.73 | |||||
| 4. Distraction | 5.30 | 0.62 | 0.13 | –0.41*** | 0.15 | 0.81 | ||||
| 5. Task conflict | 4.16 | 0.75 | 0.33*** | –0.02 | –0.20 | 0.32** | 0.90 | |||
| 6. Work engagement | 4.18 | 0.63 | –0.02 | 0.20 | 0.13 | 0.09 | –0.33** | 0.95 | ||
| 7. Cooperative style | 5.50 | 0.34 | 0.01 | –0.17 | 0.07 | 0.15 | 0.25* | –0.36*** | 0.73 | |
| 8. Competitive style | 4.13 | 0.70 | 0.17 | –0.36*** | 0.23* | 0.52*** | 0.29** | –0.07 | 0.33*** | 0.80 |
[i] Note: N = 91 workgroups (595 participants), coefficient alpha reliability estimates are listed in bold on the diagonal.
* p < 0.05, ** p < 0.01, *** p < 0.001, two tailed.
Table 3
Results of a moderator analysis for group emotional exhaustion.
| Variables | B | t | p | LLCI | ULCI |
|---|---|---|---|---|---|
| Control variables | |||||
| Task conflict | 0.02 | 0.21 | 0.84 | –0.15 | 0.18 |
| Workgroup tenure | –0.04 | –1.24 | 0.22 | –0.10 | 0.02 |
| Workgroup size | 0.08 | 2.58 | 0.01* | 0.02 | 0.14 |
| Main effect | |||||
| Relationship conflict (RC) | 0.54 | 5.77 | 0.004** | 0.35 | 0.73 |
| Distraction | –0.46 | –4.84 | 0.002** | –0.65 | –0.27 |
| RC × distraction | –0.57 | –3.72 | 0.004** | –0.88 | –0.27 |
[i] Note: b = unstandardized regression coefficient. LLCI & ULCI = lower and upper level of confidence interval.
* p < 0.05, ** p < 0.01, *** p < 0.001, two tailed.
Table 4
Results of a moderator analysis for group work engagement.
| variables | b | t | p | LLCI | ULCI |
|---|---|---|---|---|---|
| Control variables | |||||
| Relationship conflict | 0.03 | 0.24 | 0.81 | –0.22 | 0.28 |
| Workgroup tenure | 0.01 | 0.17 | 0.86 | –0.06 | 0.07 |
| Workgroup size | 0.03 | 0.92 | 0.36 | –0.04 | 0.11 |
| Main effect | |||||
| Task conflict (TC) | –0.19 | –1.56 | 0.12 | –0.44 | 0.05 |
| Cooperative style | –0.48 | –2.24 | 0.03* | –0.91 | –0.05 |
| TC × cooperative style | 0.47 | 2.26 | 0.03* | 0.06 | 0.89 |
[i] Note: b = unstandardized regression coefficient. LLCI & ULCI = lower and upper level of confidence interval.
* p < 0.05, ** p < 0.01, *** p < 0.001, two tailed.
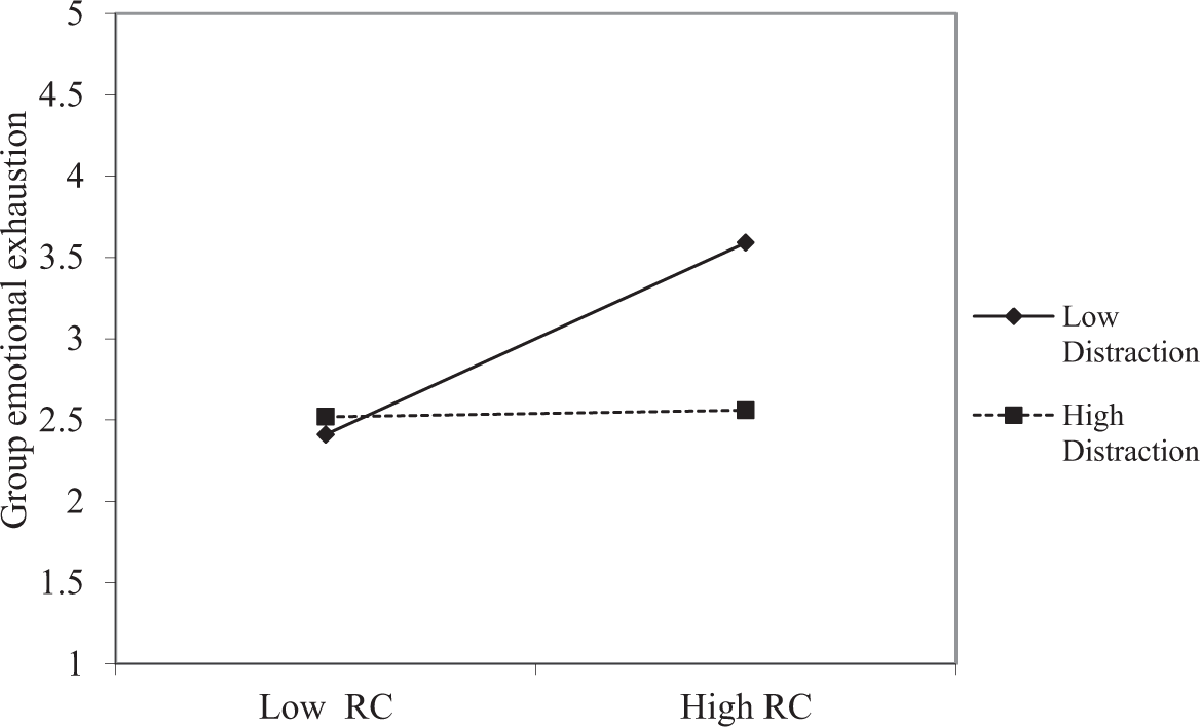
Figure 2
Interaction effect of relationship conflict (RC) and distraction in prediction of group emotional exhaustion.
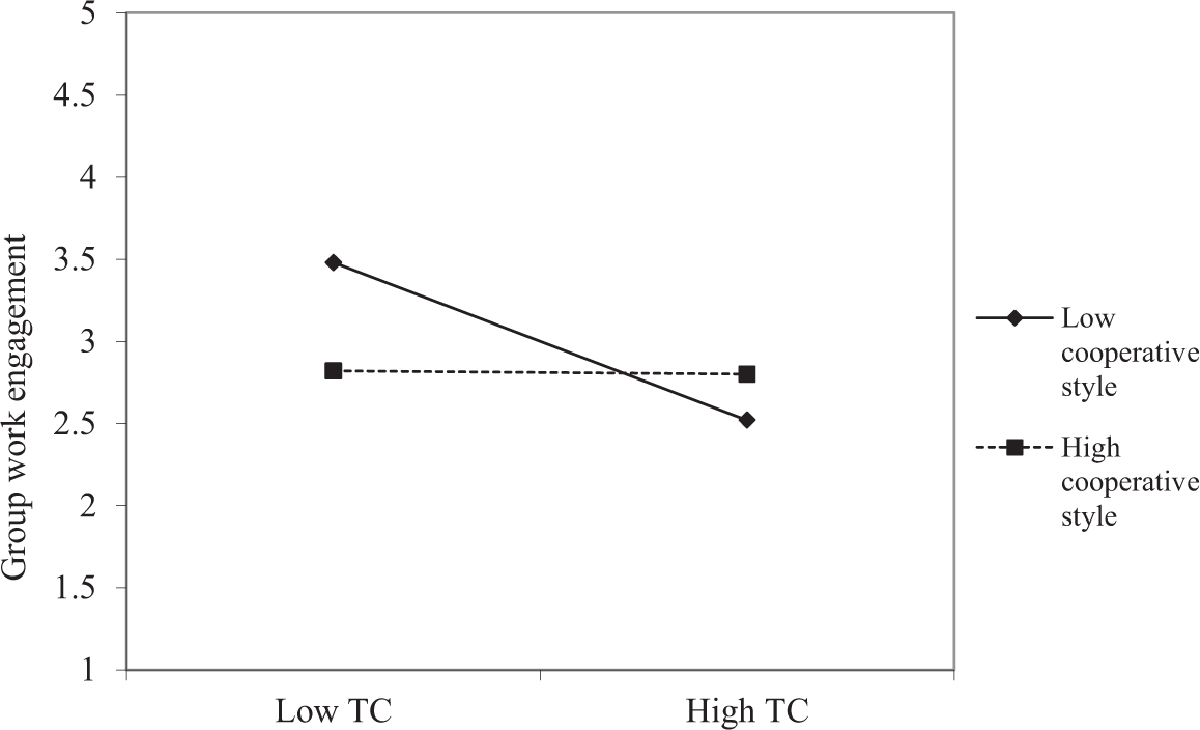
Figure 3
Interaction effect of task conflict (TC) and cooperative style of conflict management distraction in prediction of group work engagement