
Table 1
Age and teacher group differences (M and SD) in study variables: Results of 2-way analyses of variance.
| Variable | Under 45-year-olds (1) | 45–55-year-olds (2) | Over 55-year-olds (3) | Age effect | Teacher group effect | Age × teacher group | |||
|---|---|---|---|---|---|---|---|---|---|
| Class teachers (n = 95) | Subject teachers (n = 94) | Class teachers (n = 185) | Subject teachers (n = 114) | Class teachers (n = 168) | Subject teachers (n = 113) | F | F | F | |
| Workload | 4.10 0.74 | 3.93 0.86 | 4.06 0.70 | 3.94 0.79 | 3.91 0.73 | 3.86 0.69 | 2.24, ns | 4.10* | 0.36, ns |
| Break detachment | 1.54 0.67 | 1.75 0.72 | 1.54 0.76 | 1.77 0.85 | 1.60 0.74 | 2.09 0.93 | 5.35** 2 < 3 | 28.77*** | 2.57, ns |
| Break relaxation | 1.76 0.72 | 2.15 0.86 | 1.73 0.80 | 2.10 0.88 | 1.86 0.86 | 2.39 0.89 | 5.01** 2 < 3 | 46.33*** | 0.78, ns |
| Need for recovery | 3.40 0.95 | 3.26 1.04 | 3.42 0.87 | 3.27 1.01 | 3.34 0.97 | 3.20 1.03 | 0.46, ns | 3.65, ns | .01, ns |
| Exhaustion | 3.68 1.26 | 3.33 1.14 | 3.68 1.12 | 3.44 1.16 | 3.60 1.18 | 3.34 1.22 | 0.42, ns | 10.51*** | 0.12, ns |
| Cynicism | 2.49 1.09 | 2.52 1.14 | 2.65 1.22 | 2.66 1.26 | 2.64 1.23 | 2.64 1.16 | 0.99, ns | 0.18, ns | .01, ns |
| Inadequacy | 2.86 1.15 | 2.83 1.19 | 3.66 1.37 | 3.23 1.33 | 3.55 1.40 | 3.21 1.29 | 10.23*** 1 > 2–3 | 3.10, ns | 0.88, ns |
[i] *** p < 0.001, ** p < 0.01, * p < 0.05, ns = non-significant; pairwise mean comparisons with Bonferroni correction (p < 0.05).
Table 2
Correlations of study variables among subject teachers (n = 321, above the diagonal) and class teachers (n = 448, under the diagonal).
| Variable | Class teachers M (SD) | Subject teachers MM (SD) | 1 | 2 | 3 | 4 | 5 | 6 | 7 | 8 | |
|---|---|---|---|---|---|---|---|---|---|---|---|
| 1 | Workload | 4.01 (0.72) | 3.91 (0.77) | – | –0.05 | –0.24*** | –0.35*** | 0.43*** | 0.54*** | 0.30*** | 0.31*** |
| 2 | Age | 50.82 (9.28) | 48.73 (11.20) | –0.09 | – | 0.13* | 0.09 | –0.01 | 0.01 | 0.06 | 0.12* |
| 3 | Break detachment | 1.56 (0.73) | 1.88 (0.86) | –0.34*** | 0.03 | – | 0.68*** | –0.32*** | –0.39*** | –0.23*** | –0.23*** |
| 4 | Break relaxation | 1.79 (0.81) | 2.22 (0.89) | –0.27*** | 0.02 | 0.66*** | – | –0.39*** | –0.42*** | –0.25*** | –0.27*** |
| 5 | Need for recovery | 3.39 (0.93) | 3.25 (1.02) | 0.41*** | –0.03 | –0.30*** | –0.28*** | – | 0.66*** | 0.52*** | 0.55*** |
| 6 | Exhaustion | 3.65 (1.17) | 3.37 (1.17) | 0.52*** | –0.04 | –0.33*** | –0.31*** | 0.67*** | – | 0.57*** | 0.57*** |
| 7 | Cynicism | 2.61 (1.20) | 2.61 (1.19) | 0.24*** | 0.02 | –0.18*** | –0.17** | 0.48*** | 0.59*** | – | 0.79*** |
| 8 | Sense of inadequacy | 3.27 (1.36) | 3.10 (1.28) | 0.26*** | 0.16** | –0.16** | –0.16** | 0.46*** | 0.54*** | 0.81*** | – |
[i] *** p < 0.001, ** p < 0.01, * p < 0.05.
Table 3
Results of hierarchical regression analyses for recovery outcomes; break detachment as a recovery experience.
| Class teachers (n = 448) | Subject teachers (n = 321) | |||||||
|---|---|---|---|---|---|---|---|---|
| Need for recovery β | Exhaustion β | Cynicism β | Inadequacy β | Need for recovery β | Exhaustion β | Cynicism β | Inadequacy β | |
| Step 1. Workload ΔR2 R2 | 0.35*** 0.17*** 0.17*** | 0.46*** 0.27*** 0.27*** | 0.21*** 0.06*** 0.06*** | 0.25*** 0.07*** 0.07*** | 0.37*** 0.18*** 0.18*** | 0.47*** 0.29*** 0.29*** | 0.26*** 0.09*** 0.09*** | 0.27*** 0.10*** 0.10*** |
| Step 2. Break detachment ΔR2 R2 | –0.18*** 0.03 0.20*** | –0.18*** 0.03*** 0.29*** | –0.11* 0.01* 0.07*** | –0.08 0.01 0.07*** | –0.24*** 0.05*** 0.23*** | –0.29*** 0.08*** 0.36*** | –0.18** 0.03** 0.12*** | –0.18*** 0.03** 0.12*** |
| Step 3. Age ΔR2 R2 | 0.01 0.00 0.20*** | 0.00 0.00 0.29*** | 0.04 0.00 0.07*** | 0.18*** 0.04*** 0.11*** | 0.05 0.00 0.23*** | 0.07 0.00 0.36*** | 0.10 0.01 0.13*** | 0.16** 0.02** 0.15*** |
| Step 4. Age × break detachment ΔR2 R2 | –0.02 0.00 0.20*** | 0.03 0.00 0.30*** | 0.05 0.00 0.07*** | 0.04 0.00 0.11*** | –0.10* 0.01* 0.24** | –0.11* 0.01* 0.38*** | –0.06 0.00 0.13*** | –0.13* 0.02** 0.16*** |
[i] Note: β = standardized beta-coefficient from the final step, ΔR2 = change in explanation rate in each step, R2 = explanation rate.
*** p < 0.001, ** p < 0.01, * p < 0.05.
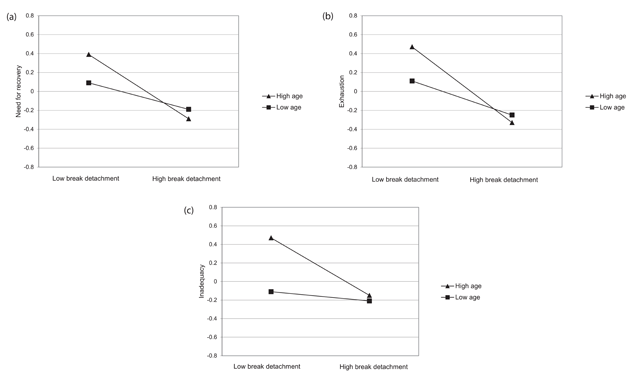
Figure 1
Significant interaction effects between break detachment and need for recovery (a), exhaustion (b), and sense of inadequacy (c) among subject teachers.
Table 4
Results of hierarchical regression analyses for recovery outcomes; break relaxation as a recovery experience.
| Class teachers (n = 448) | Subject teachers (n = 321) | |||||||
|---|---|---|---|---|---|---|---|---|
| Need for recovery β | Exhaustion β | Cynicism β | Inadequacy β | Need for recovery β | Exhaustion β | Cynicism β | Inadequacy β | |
| Step 1. Workload ΔR2 R2 | 0.36*** 0.17*** 0.17*** | 0.47*** 0.27*** 0.27*** | 0.21*** 0.06*** 0.06*** | 0.24*** 0.07*** 0.07*** | 0.33*** 0.18*** 0.18*** | 0.44*** 0.29*** 0.29*** | 0.24*** 0.09*** 0.09*** | 0.25*** 0.10*** 0.10*** |
| Step 2. Break relaxation ΔR2 R2 | –0.17*** 0.03*** 0.20*** | –0.18*** 0.03*** 0.30*** | –0.11* 0.01* 0.07*** | –0.10* 0.01* 0.07*** | –0.28*** 0.06*** 0.25*** | –0.28*** 0.06** 0.35*** | –0.18** 0.02** 0.12*** | –0.21*** 0.03** 0.13*** |
| Step 3. Age ΔR2 R2 | –0.00 0.00 0.20*** | 0.00 0.00 0.30*** | 0.05 0.00 0.07*** | 0.19*** 0.03*** 0.11*** | 0.04 0.00 0.25*** | 0.08 0.00 0.35*** | 0.12* 0.01 0.12*** | 0.19** 0.02** 0.15*** |
| Step 4. Age × break relaxation ΔR2 R2 | –0.08 0.01 0.21*** | –0.00 0.00 0.30*** | 0.06 0.00 0.07*** | 0.02 0.00 0.11*** | –0.03 0.00 0.25*** | –0.11 0.01 0.36*** | –0.09 0.01 0.13*** | –0.14 0.02 0.17*** |
[i] Note: β = standardized beta-coefficient from the final step, ΔR2 = change in explanation rate in each step, R2 = explanation rate.
*** p < 0.001, ** p < 0.01, * p < 0.05.