
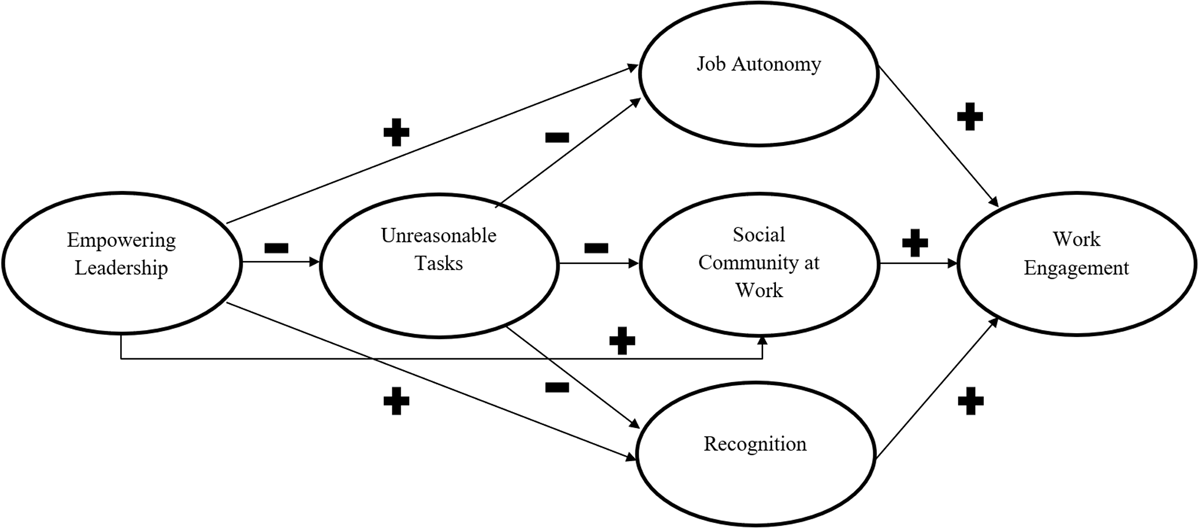
Figure 1
Visual representation of the model.
Table 1
Means (M), standard deviations (SD) and correlations (n = 3059).
| Variables | M | SD | 1. | 2. | 3. | 4. | 5. | 6. | 7. |
|---|---|---|---|---|---|---|---|---|---|
| 1. Work engagement | 5.65 | 1.24 | – | ||||||
| 2. Empowering leadership | 3.74 | 1.08 | 0.31*** | – | |||||
| 3. Job autonomy | 3.93 | 0.80 | 0.39*** | 0.55*** | – | ||||
| 4. Social community at work | 3.87 | 0.91 | 0.42*** | 0.60*** | 0.58*** | – | |||
| 5. Recognition | 3.76 | 0.94 | 0.37*** | 0.70*** | 0.63*** | 0.69*** | – | ||
| 6. Unreasonable tasks | 2.43 | 0.98 | –0.28*** | –0.40*** | –0.63*** | –0.49*** | –0.53*** | – | |
| 7. Age | – | – | 0.12*** | –0.20*** | –0.18*** | –0.12*** | –0.06** | 0.13*** | – |
| 8. Gender | – | – | –0.01 | 0.02 | 0.05** | 0.00 | 0.08*** | –0.04* | 0.08*** |
[i] Note: * p < 0.05. ** p < 0.01. *** p < 0.001.
Table 2
Squared correlations matrix, AVEs, and RRCs (n = 3059).
| Variables | 1. | 2. | 3. | 4. | 5. | 6. | AVE | RRC |
|---|---|---|---|---|---|---|---|---|
| 1. Work engagement | – | 0.80 | 0.93 | |||||
| 2. Empowering leadership | 0.10 | – | 0.76 | 0.80 | ||||
| 3. Job autonomy | 0.16 | 0.31 | – | 0.50 | 0.84 | |||
| 4. Social community at work | 0.18 | 0.36 | 0.34 | – | 0.64 | 0.89 | ||
| 5. Recognition | 0.14 | 0.49 | 0.40 | 0.47 | – | 0.72 | 0.76 | |
| 6. Unreasonable tasks | 0.08 | 0.15 | 0.40 | 0.23 | 0.28 | – | 0.53 | 0.90 |
Table 3
Model comparisons (n = 3059).
| Models | χ2 | df | SRMR | RMSEA | CFI | TLI |
|---|---|---|---|---|---|---|
| M0 | 3590.21 | 298 | 0.05 | 0.06 | 0.94 | 0.92 |
| M1 | 4014.37 | 298 | 0.06 | 0.06 | 0.93 | 0.91 |
| M2 | 4003.49 | 298 | 0.06 | 0.06 | 0.93 | 0.91 |
| M3 | 4138.55 | 298 | 0.06 | 0.07 | 0.92 | 0.91 |
| M4 | 4587.06 | 301 | 0.07 | 0.07 | 0.92 | 0.90 |
Table 4
Standardized direct effects of the structural model.
| Exogenous variables | Endogenous variables | Direct effects |
|---|---|---|
| Empowering leadership | Work engagement | 0.03 |
| Unreasonable tasks | 0.03 | |
| Job autonomy | 0.25*** | |
| Social community at work | 0.26*** | |
| Recognition | 0.07 | |
| Age | 0.21*** | |
| Gender | –0.04** | |
| Empowering leadership | Job autonomy | 0.35*** |
| Unreasonable tasks | –0.53*** | |
| Age | –0.04** | |
| Gender | 0.02 | |
| Empowering leadership | Social community at work | 0.49*** |
| Unreasonable tasks | –0.35*** | |
| Age | 0.02 | |
| Gender | –0.03 | |
| Empowering leadership | Recognition | 0.60*** |
| Unreasonable tasks | –0.35*** | |
| Age | 0.10*** | |
| Gender | 0.04** | |
| Empowering leadership | Unreasonable task | –0.38*** |
| Age | 0.06** | |
| Gender | –0.04* |
[i] Note: * p < 0.05. ** p < 0.01. *** p < 0.001.
Table 5
Standardized indirect effects of the structural model.
| Exogenous variables | Mediator(s) | Endogenous variables | Indirect effects |
|---|---|---|---|
| Empowering leadership | Unreasonable tasks (Med1) and Job autonomy (Med2) | Work engagement | 0.05*** |
| Unreasonable tasks (Med1) and Social community at work (Med2) | 0.03*** | ||
| Unreasonable tasks (Med1) and Recognition (Med2) | 0.01 | ||
| Job autonomy/Social community at work/Recognition/Unreasonable tasks | 0.31*** | ||
| Job autonomy | 0.09*** | ||
| Social community at work | 0.13*** | ||
| Recognition | 0.04 | ||
| Unreasonable tasks | 0.04 | ||
| Unreasonable tasks | Job autonomy | –0.13*** | |
| Social community at work | –0.09*** | ||
| Recognition | –0.02 | ||
| Job autonomy/Social community at work/Recognition | –0.29*** | ||
| Empowering leadership | Unreasonable tasks | Job autonomy | 0.14*** |
| Social community at work | 0.10*** | ||
| Recognition | 0.12*** |
[i] Notes: M1 = First mediator and M2 = Second mediator, * p < 0.05. ** p < 0.01. *** p < 0.001.
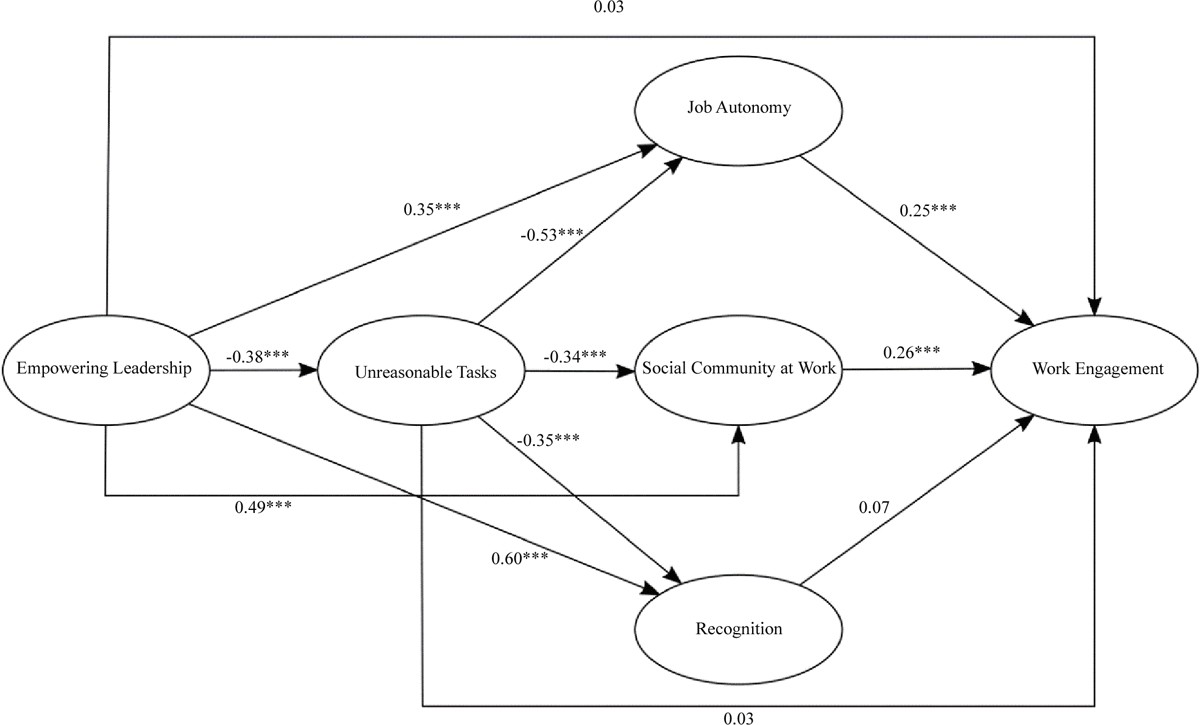
Figure 2
Visualization of structural model with standardized direct effects.
Note: * p < 0.05. ** p < 0.01. *** p < 0.001.