
Table 1
Descriptive statistics and intercorrelations of the study variables.
| 1 | 2 | 3 | 4 | 5 | 6 | 7 | |
|---|---|---|---|---|---|---|---|
| 1. AWO | – | ||||||
| 2. EXT | 0.19*** | – | |||||
| 3. INJ | 0.04* | 0.44*** | – | ||||
| 4. IDE | –0.13*** | 0.23*** | 0.60*** | – | |||
| 5. INT | –0.20*** | 0.13*** | 0.37*** | 0.58*** | – | ||
| 6. AMOT | 0.33*** | 0.22*** | –0.07*** | –0.31*** | –0.21*** | – | |
| 7. WE | –0.28*** | 0.05** | 0.30*** | 0.52*** | 0.75*** | –0.29*** | – |
| M (SD) | 3.74 (1.42) | 3.79 (1.29) | 4.54 (1.32) | 5.20 (1.41) | 4.69 (1.52) | 1.94 (1.33) | 3.55 (.86) |
[i] Note: * p < 0.05. ** p < 0.01. *** p < 0.001. AWO = anti–work orientation; EXT = extrinsic regulation; INJ = introjected regulation; IDE = identified regulation; INT = intrinsic motivation; AMOT = amotivation; WE = work engagement.
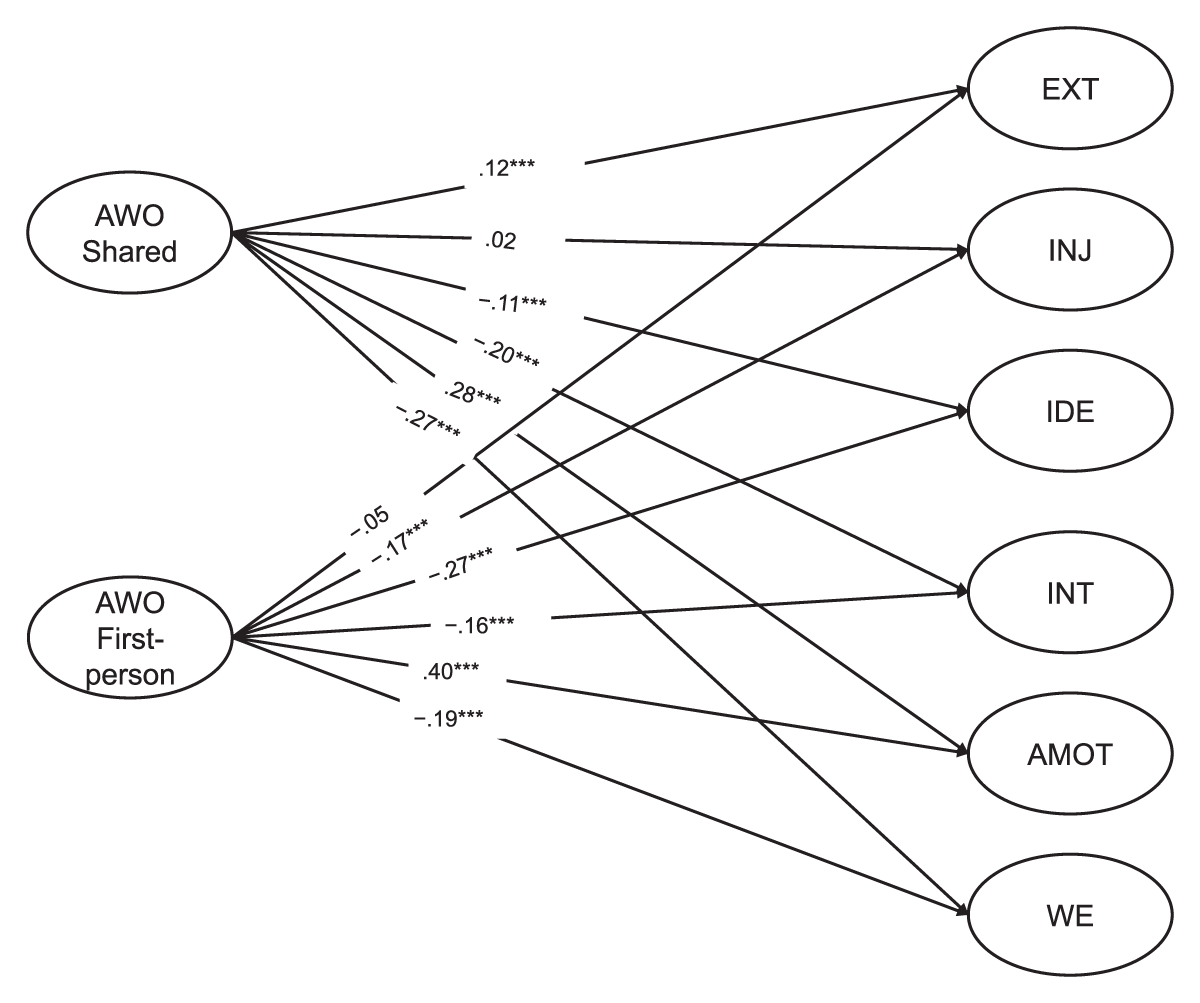
Figure 1
Structural model depicting standardized estimates of the relationships between the latent variables.
Note: Indicators of latent variables and intercorrelations are omitted in the figure. *** Correlations significant at the p < 0.001 level. AWO = anti-work orientation; EXT = extrinsic regulation; INJ = introjected regulation; IDE = identified regulation; INT = intrinsic motivation; AMOT = amotivation; WE = work engagement.