
Table 1
Sample Characteristics of Participating Nurses and Physicians (N = 1,329).
| Nurses (N = 1,091) | Physicians (N = 238) | |
|---|---|---|
| Age | 42 years | 44.2 years |
| Gender (Female) | 95% | 48.3% |
| Contract (Permanent) | 92.7% | 74% |
| Tenure | 10.44 years | 7.87 years |
Table 2
Descriptive Statistics and Correlations Between all Study Variables (N = 1,329).
| Scale | M | SD | 1 | 2 | 3 | 4 | 5 | 6 | 7 | |||||||
|---|---|---|---|---|---|---|---|---|---|---|---|---|---|---|---|---|
| 1. Age | 42.47 | 10.89 | ||||||||||||||
| 2. Gender (Male) | 0.13 | 0.34 | .07 | * | ||||||||||||
| 3. Temporary contract | 0.23 | 0.78 | –.21 | ** | .05 | |||||||||||
| 4. PO leadership | 2.92 | 0.73 | .04 | –.04 | –.00 | |||||||||||
| 5. EO leadership | 3.38 | 0.70 | .04 | –.05 | .06 | * | .53 | ** | ||||||||
| 6. Goal clarity | 4.11 | 0.74 | .14 | ** | –.10 | ** | –.09 | ** | .39 | ** | .31 | ** | ||||
| 7. Trust | 3.43 | 0.94 | .11 | ** | –.06 | * | –.03 | .46 | ** | .53 | ** | .45 | ** | |||
| 8. Job insecurity | 1.70 | 0.61 | .02 | –.00 | .02 | –.11 | ** | –.15 | ** | –.19 | ** | –.18 | ** | |||
[i] Notes: * p < .05, ** p < .01, PO leadership = production-oriented leadership, EO leadership = employee-oriented leadership.
Table 3
Mediation of the Effect of the Two Leadership Styles and Job Insecurity Through Goal Clarity and Trust (Standardized Coefficients).
| Direct effects | Standardized coefficients |
|---|---|
| PO leadership → job insecurity | .08, p = .14 |
| EO leadership → job insecurity | –.09 p = .12 |
| PO leadership → goal clarity | .43, p < .001 |
| PO leadership → trust | .25, p < .001 |
| EO leadership → goal clarity | .10, p = .05 |
| EO leadership → trust | .44, p < .001 |
| Goal clarity → job insecurity | –.23, p < .001 |
| Trust → job insecurity | –.08 p = .12 |
| Indirect effects | Standardized coefficients and the 95% confidence interval |
| Total indirect effect for PO leadership | –.12, p < .001, 95% BC CI [–.18, –.07] |
| Specific indirect effect for PO leadership through goal clarity | –.10, p < .001, 95% BC CI [–.16, –.05] |
| Specific indirect effect for PO leadership through trust | –.02, p = .13, 95% BC CI [–.05, .01] |
| Total indirect effect for EO leadership | –.06, p = .03, 95% BC CI [–.11, –.01] |
| Specific indirect effect for EO leadership through goal clarity | –.02, p = .08, 95% BC CI [–.05, .00] |
| Specific indirect effect for EO leadership through trust | –.03, p = .14, 95% BC CI [–.08, .01] |
[i] Note. PO leadership = production-oriented leadership, EO leadership = employee-oriented leadership; the coefficients are considered significant when the 95% bias corrected bootstrap confidence interval (BC CI) does not include zero; the model fit for the indirect model is as follows: χ2 (337) = 1,543.22; p < .001; CFI = .92; RMSEA = .05; 95% CI (.049, .055); SRMR = .05.
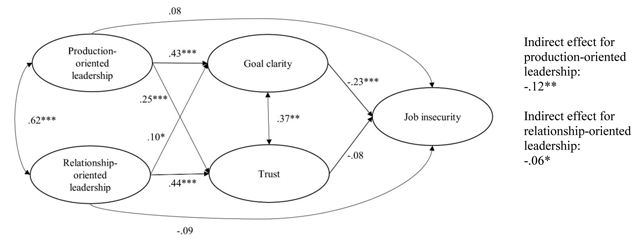
Figure 1
Mediation model with goal clarity and trust as explanatory factors between the leadership styles and job insecurity (standardized coefficients). * p < .05, ** p < .01; the model fit is as follows: χ2 (337) = 1,543.22; p < .001; CFI = .92; RMSEA = .05; 95% CI (.049, .055); SRMR = .05. For readability, control variables were not included in the figure.