
Table 1
Odds ratios for disturbed sleep in the past 12 months and percent increase in NHP sleep problems at follow-up, associated with baseline job demands and decision latitude and traumatic life events between baseline and follow-upa.
| OR (95% CI) for disturbed sleep in the past 12 months | Percent increase (95% CI) NHP sleep problems at follow-up | |
|---|---|---|
| No. Events (1 unit increase) | 1.11 (1.00; 1.23) | 7.5 (0.8; 14.6) |
| Demands (1 SD increase) | 1.09 (1.02; 1.17) | 6.1 (2.0; 10.3) |
| Decision latitude (1 SD increase) | 0.97 (0.91; 1.04) | 0.5 (–3.7; 4.8) |
[i] aAdjusted for age, gender, and socio-economic position, baseline CESD score, and baseline self-rated health.
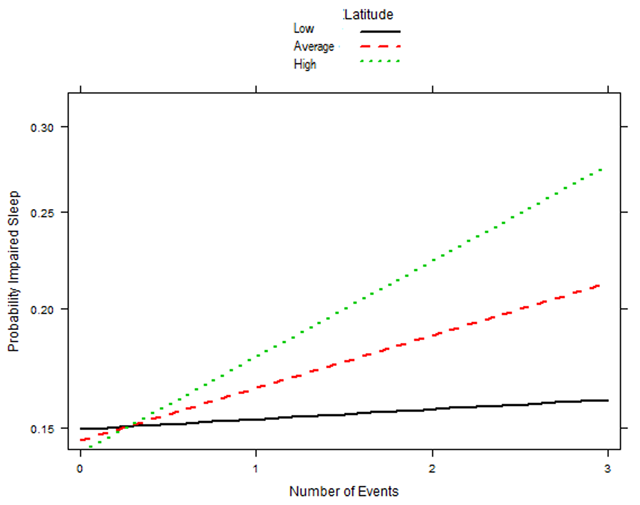
Figure 1
Joint effect of baseline decision latitude and life events between baseline and follow-up on the probability of impaired sleep between baseline and follow-up. Adjusted for gender, age, socio-economic position, baseline depressive symptoms and self-reported health.
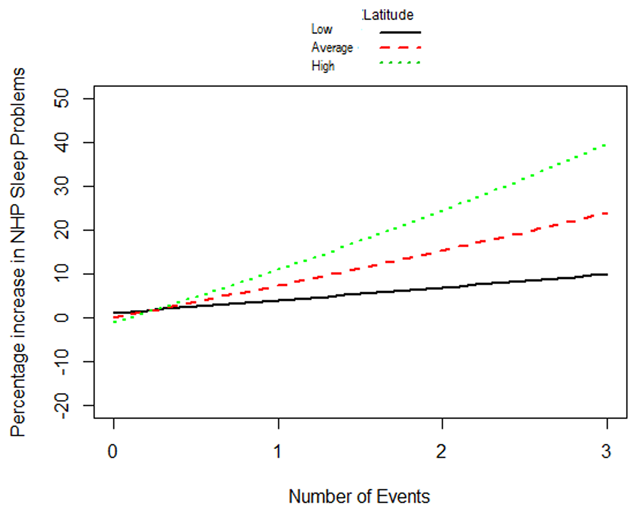
Figure 2
Joint effect of baseline decision latitude and life events between baseline and follow-up on percent increase of impaired sleep symptoms at follow-up. Adjusted for gender, age, socio-economic position, baseline depressive symptoms and self-reported health.