
Table 1
Overview and Demographic Characteristics of the Study Samples.
| Sample 1 | Sample 2 | Sample 3 | |
|---|---|---|---|
| N | 186 | 426 | 818 |
| Gender | |||
| Male (%) | 76 | 11 | 43 |
| Female (%) | 24 | 89 | 57 |
| Age | |||
| Range | 20–64 | 20–65 | 21–66 |
| Mean | 46.75 | 44.03 | 46.31 |
| SD | 10.59 | 12.11 | 11.93 |
| Education | |||
| Primary school, ages 7–16 (%) | 16 | 7 | 8 |
| Upper secondary school, ages 17–19 (%) | 51 | 55 | 40 |
| University (%) | 33 | 38 | 47 |
| Tenure | |||
| Range | 1 month to 44 years | 2 months to 34 years | 1 month to 45 years |
| Mean (years) | 20.25 | 8.21 | 9.97 |
| SD (years) | 13.75 | 7.10 | 10.05 |
| Hours worked | |||
| Full-time (%) | 99 | 43 | 81 |
| Part-time (%) | 1 | 57 | 19 |
| Contract | |||
| Permanent (%) | 94 | 90 | 89 |
| Temporary (%) | 6 | 10 | 11 |
| Phase 1: Item generation | x | x | |
| Phase 2: Assessment of content validity | x | x | |
| Phase 3: Item selection and factorial validity | x | x | |
| Phase 4: Replication | x | ||
| Phase 5: Criterion-related validity | x | ||
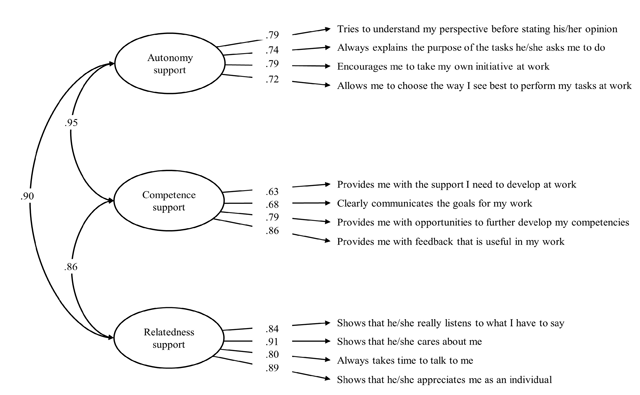
Figure 1
Factor structure of the NSu-WS. The two scales have been validated in Swedish and later translated into English by the research group in collaboration with a bilingual expert.
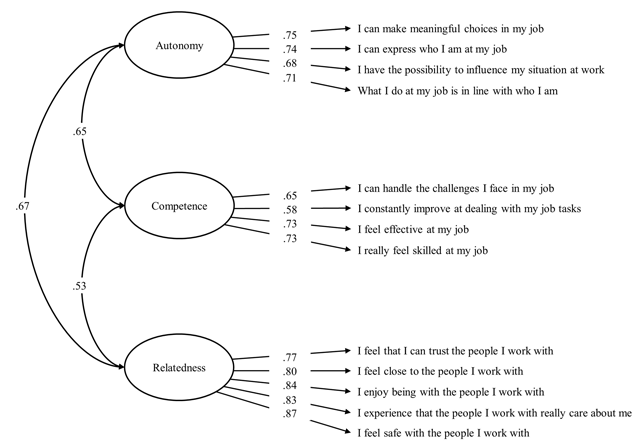
Figure 2
Factor structure of the NSa-WS.
Table 2
Model Fit of Alternative One- and Two-factor Models and the Hypothesized Three-Factor Models.
| Model | χ2 | df | p | RMSEA [90%CI) | CFI | SRMR | AIC | BIC | ∆χ2 | ∆df |
|---|---|---|---|---|---|---|---|---|---|---|
| Need satisfaction | ||||||||||
| One-factor model | 1010.29 | 65 | .001 | .13 [.13, .14] | .77 | .10 | 22200.23 | 22383.56 | 638.25b | 3 |
| Autonomy-Competencea | 424.82 | 64 | .001 | .08 [.08, .09] | .91 | .05 | 21450.67 | 21638.70 | 179.26b | 2 |
| Autonomy-Relatednessa | 686.82 | 64 | .001 | .11 [.10, .12] | .85 | .08 | 21778.46 | 21966.49 | 458.47b | 2 |
| Competence-Relatednessa | 635.28 | 64 | .001 | .11 [.10, .11] | .86 | .09 | 21721.19 | 21909.22 | 321.41b | 2 |
| Three-factor model | 198.43 | 62 | .001 | .05 [.04, .06] | .97 | .04 | 21164.13 | 21361.56 | ||
| Need support | ||||||||||
| One-factor | 567.35 | 54 | .001 | .11 [.10, .12] | .91 | .04 | 22162.53 | 22331.67 | 228.31b | 3 |
| Autonomy-Competence supporta | 342.41 | 53 | .001 | .08 [.07, .09] | .95 | .04 | 21861.62 | 22035.46 | 20.91b | 2 |
| Autonomy-Relatedness supporta | 468.25 | 53 | .001 | .10 [.09, .11] | .92 | .04 | 22026.81 | 22200.65 | 151.64b | 2 |
| Competence-Relatedness supporta | 545.32 | 53 | .001 | .11 [.10, .12] | .91 | .04 | 22134.94 | 22308.78 | 198.87b | 2 |
| Three-factor model | 320.04 | 51 | .001 | .08 [.07, .09] | .95 | .03 | 21832.46 | 22015.69 | ||
[i] Note. a Items for these two factors were combined into a single latent factor. b Scaled chi-square difference test against the hypothesized three-factor model. All comparisons were statistically significant at alpha = .001.
Table 3
Latent Variable Correlations (F) and Omega Coefficients (w) for the Study Variables (N = 816).
| Need for autonomy | Need for competence | Need for relatedness | Autonomy support | Competence support | Relatedness support | Omega (w) | |
|---|---|---|---|---|---|---|---|
| Job resources | |||||||
| 1. Influence | .85 | .37 | .45 | .59 | .55 | .45 | .86 |
| 2. Skills | .78 | .41 | .48 | .52 | .57 | .38 | .84 |
| 3. Social support | .57 | .39 | .79 | .56 | .54 | .53 | .75 |
| Optimal functioning | |||||||
| 5. Job satisfaction | .69 | .44 | .53 | .57 | .62 | .50 | .80 |
| 6. Vigor | .62 | .51 | .44 | .44 | .44 | .39 | .90 |
| 7. Exhaustion | –.53 | –.42 | –.44 | –.44 | –.45 | –.41 | .89 |
| 8. Turnover intention | –.59 | –.36 | –.50 | –.50 | –.53 | –.45 | .80 |
| 9. Job performance | .39 | .56 | .33 | .28 | .27 | .31 | .84 |
| 10. Autonomous motivation | .69 | .41 | .43 | .42 | .45 | .39 | .85 |
[i] Note. All correlations were p < .001.
Table 4
Differences Between the Correlations of Need Support and Need Satisfaction (N = 816)
| z-score | pa | |||
|---|---|---|---|---|
| NSa ↔ BNa (Φ = .68) | vs. | NSc ↔ BNa (Φ = .63) | 6.08 | .000 |
| NSa ↔ BNa (Φ = .68) | vs. | NSr ↔ BNa (Φ = .57) | 9.34 | .000 |
| NSc ↔ BNc (Φ = .30) | vs. | NSa ↔ BNc (Φ = .31) | –0.95 | .172 |
| NSc ↔ BNc (Φ = .30) | vs. | NSr ↔ BNc (Φ = .32) | –1.14 | .128 |
| NSr ↔ BNr (Φ = .51) | vs. | NSa ↔ BNr (Φ = .51) | 0.00 | .500 |
| NSr ↔ BNr (Φ = .51) | vs. | NSc ↔ BNr (Φ = .50) | 0.63 | .264 |
[i] Note. BNa = need satisfaction autonomy, BNc = need satisfaction competence, BNr = need satisfaction relatedness, NSa = autonomy need support, NSc = competence need support, NSr = relatedness need support.
a One-tailed p-value.