
The evolution of employment and working conditions is a story of continual change. In recent decades, significant technological, economic, and political shifts have generated concerns about the future of jobs. Set against a backdrop of economic crises, downsizing, mergers, financial pressures, and global competition, the stability and predictability once associated with employment increasingly give way to job insecurity and exploitation (Bazzoli & Probst, 2023b). Indeed, 20% of the US workforce (Gallup, 2023) and 10% of European workers (Eurofound, 2024) worry that they might be laid off in the near future.
Unsurprisingly, job insecurity, that is, a threat to the continuity and stability of one’s employment (Shoss, 2017), has become a concern for scholars and policymakers alike: stable and secure jobs are one of the hallmarks of the International Labor Organization’s Decent Work initiative, as there is overwhelming empirical evidence that job insecurity is associated with worse organisational, physical, and mental health outcomes (De Witte et al., 2016; Shoss, 2017; Sverke et al., 2002). These findings were supported by several primary studies that investigated job insecurity using various designs, each with strengths and limitations. Hence, the scope of this review is twofold: first, we take stock of research designs that have been used to investigate job insecurity since 1984 and evaluate their trajectories over time; second, we look at the most-used job insecurity scales in the literature and evaluate them on several aspects, including readability, cross-cultural translations and use, and rating scales associated with items.
Our review contributes to the field in two main ways. First, understanding where the field of job insecurity research has been and where it is headed can provide meaningful insights into the strengths and weaknesses of our scientific approaches and can suggest paths forward to strengthen the quality of research and the conclusions based on it. Inferences from quantitative data are as good as the design that generated the data and the degree of accuracy with which constructs were conceptualised and measured. Second, our review is comprehensive and cuts across various disciplines: although we are organisational psychologists, we envision this paper as a brief methodological one-stop shop for scholars who are interested in investigating job insecurity by providing ‘good practices’ to help select the most appropriate scale and research design, and in turn increase the strengths of the inferences that can be drawn from their results.
Introduction
Widespread scholarly interest in job insecurity arguably originated from the publication of Greenhalgh and Rosenblatt’s (1984) article. In their paper, they proposed a theoretical model of the causes and effects of job insecurity, along with organisational outcomes and potential key moderators. Since then, the amount of job insecurity-related articles published in peer-reviewed journals has grown from just a handful to thousands of articles (Bazzoli & Probst, 2022), perhaps in part as a response to worsening economic conditions and crises (Probst et al., 2020; Sinclair et al., 2021). A few years after the publication of that seminal paper, at the end of the 1980s, when mass layoffs were taking place, several areas of debate arose, some of which are more or less settled (e.g., the nature and key elements of job insecurity) but many remain open (e.g., whether it is meaningful to differentiate between cognitive and affective reactions, whether job insecurity is a unidimensional or multidimensional construct, Bazzoli & Probst, 2023a.)
Conceptualizing Job Insecurity
Although there is substantial agreement among scholars that job insecurity is a pervasive stressor in today’s workplaces, its definition and conceptualisation are still debated. Job insecurity has been defined in various ways in the extant literature (e.g., Shoss, 2017, listed 20 definitions), which undermines the goal of building a coherent body of knowledge that will generate meaningful practical implications to improve outcomes for job-insecure workers. In this paper, we globally define job insecurity as ‘a perceived threat to the continuity and stability of employment as it is currently experienced’ (Shoss, 2017). This definition implies three key elements of job insecurity (Klandermans & Van Vuuren, 1999): it is a subjective perception, a forward-looking phenomenon, and it implies a degree of uncertainty. We first provide a brief overview of these characteristics, along with different approaches to job insecurity, and then discuss how these characteristics are relevant in terms of measurement efforts and research design.
First, as noted elsewhere (see, e.g., De Witte, 1999), job insecurity is a subjective perception that is best conceptualised from ‘the eye of the beholder’; hence, workers in the same objective situation (e.g., working for a firm that is undergoing rounds of layoffs or having a fixed-term contract) might perceive job insecurity differently. Until very recently, disciplines outside of organisational sciences tended to conflate this subjective perception with objective characteristics of the job, but there seems to be evidence that scholars in economics and public health are increasingly recognising job insecurity as a subjective phenomenon (Bazzoli & Probst, 2022). We stand firmly behind the idea that job insecurity is subjectively experienced, but we recognise that objective factors also influence it. Second, a threat implies a forecast, a forward-looking guess on the future. In this case, it is a potential loss that may happen at some point in the future. It refers to an employee’s current employment at their current organisation, distinguishing job insecurity from occupation insecurity (Roll et al., 2023). Last, since the threat has not occurred yet, job insecurity involves, as the term implies, a degree of uncertainty in contrast to actual job loss (i.e., unemployment) or certainty about a future loss of employment. In other words, job-insecure employees are uncertain about what their future employment will look like.
Based on these core characteristics, scholars have advanced several subdimensions of job insecurity, reflecting the belief that job insecurity might not be a global or unidimensional construct. For ease of exposition, we group them along three axes: quantitative vs qualitative, cognitive vs affective, and chronic vs fluctuating. In this regard, quantitative job insecurity refers to uncertainty related to the job as a whole (Sverke et al., 2002), whereas qualitative job insecurity refers to threats to valued job features (e.g., favourable work conditions, employment conditions, coworkers, and job scope; Brondino et al., 2020). Further, insecurity might refer to cognitive perceptions related to potential threat (i.e., cognitive job insecurity) as well as to emotional experiences and affective reactions to those cognitive perceptions (i.e., affective job insecurity; Bazzoli et al., 2023). The temporal dimension is also relevant: job insecurity may be experienced as a chronic stressor, that is, chronically high and stable over time (Klug et al., 2019) or as a fluctuating phenomenon, perhaps in response to macroeconomic forces (Debus et al., 2019). It is crucial to differentiate between multidimensionality and specificity. Greenhalgh and Rosenblatt (1984) emphasised that job insecurity is best understood in terms of its severity and the feeling of powerlessness to mitigate the risk of job loss. Later, Hartley et al. (1991) refined these factors into probability and severity. Although Hartley et al. (1991) conceptualised job insecurity as consisting of these two components, later measures, such as those by Lee et al. (2008), tend to assess them indirectly through response scales rather than treating them as distinct dimensions.
Measurement Considerations
Reliably and validly measuring job insecurity remains challenging because it is an individual perception. Unlike other constructs in the organisational sciences, measuring other-reported job insecurity (e.g., asking coworkers or an employee’s direct supervisor to report a focal employee’s perceived levels of job insecurity) makes little conceptual sense, given the above arguments. Similarly, biological and physiological measures are of little help: although there is evidence that stress can be measured using physiological measures (e.g., cortisol and heart rate; Ganster et al., 2018), there is no evidence that they measure job insecurity. Physiological stress is perhaps best conceptualised as an outcome of job insecurity instead of its measurement.
Self-report scales remain the only viable measurement instrument, but they do come with several limitations. For instance, as we will discuss later, there are several instances in which scholars shortened, adapted, or edited validated scales, making comparison across studies more difficult. Contaminated measurement is also a legitimate worry. Older scales tend to include dimensions that, although they made sense at the time, now include facets that best represent outcomes or moderators of job insecurity. Examples are the Johnson et al. (1984) scale, which includes items that seem to measure employees’ perceived control over their employment situation and the Ashford et al. (1989) scale, which contains items that measure perceived powerlessness; both of which were later identified as moderators or mediators (Probst et al., 2014; Vander Elst, Richter, et al., 2014). However, besides those older examples, agreement regarding the underlying dimensionality of job insecurity remains uncertain. Affective reactions offer a compelling case: some scholars firmly believe that they should not be included in job insecurity scales (Shoss, 2017) as they are best conceptualised as a mediator between job insecurity (held to be a purely cognitive perception) and outcomes, whereas others include them as a subdimension of a higher-order job insecurity factor (Chirumbolo et al., 2020) or as a separate scale (Bazzoli & Probst, 2023a; Probst, 2003). Similarly, there is some debate on whether qualitative job insecurity scales should measure overall perceptions or if they should outline the job features that might be relevant if lost: Fischmann et al. (2022) validated a generic scale that does not specify what job features might change; Hellgren et al.’s (1999) scale focuses on worsening employment conditions; and Brondino et al. (2020) derived their dimensions from the European Working Conditions Survey by Eurofound, which is used by many European countries as a framework to decrease psychosocial risks at work (Szeker et al., 2023).
Our review is organised as follows: we first search for published job insecurity papers and code them, along with 35 of the most cited job insecurity scales; we then discuss temporal trajectories of designs and methods in job insecurity research, and delve into the most-used scales and evaluate them in terms of their readability, the type of validity that was investigated, as well as any cross-country validation efforts that were made. We conclude with several good practices to help guide researchers in future job insecurity investigations.
Method
Literature Search
A comprehensive literature search was conducted in November 2023 to identify articles related to job insecurity. APA PsycInfo was used to gather papers published between 1984, the year of Greenhalgh and Rosenblatt’s seminal article, and November 2023. Article titles and abstracts were searched for the following terms: job security, job insecurity, job certainty, job (un)certainty, employment security, and employment (in)security. For inclusion, articles needed to be peer-reviewed and in English. We identified papers in which job insecurity was a focal construct and articles in which job insecurity had a more marginal significance, for instance, because it was one of many outcomes or a control variable. The search yielded 1,039 entries, which was reduced to 1000 after excluding some duplicates and some irrelevant articles. The complete list of included papers is available in our repository within the Open Science Framework, which can be accessed at https://osf.io/38zt2/.
Coding process
We first generated three macro-categories representing quantitative, qualitative, and mixed methods designs. Given that industrial and organisational psychology is mainly a quantitative field that relies on postpositivist epistemologies (Aguinis et al., 2009; Bazzoli, 2022), quantitative research designs were further coded into more fine-grained categories, while qualitative and mixed-methods designs were grouped into a single category. The following categories were identified: (i) correlational, cross-sectional; (ii) complex correlational (e.g., studies that consider dyadic data, multisource data, or nested data); (iii) longitudinal designs, to include two-wave, follow-up, and cross-lagged designs; (iv) experimental and quasi-experimental designs; (v) qualitative (to include interviews, text analysis, focus groups), case studies, and mixed methods; (vi) reviews and meta-analyses; (vii) validation studies; and (viii) conceptual studies, commentaries, editorials, book reviews, and statistical modelling.
The third and fourth authors independently coded the papers and assigned each to a methodological category.1 The last author then coded a set of 308 randomly selected papers (i.e., roughly 31%) to evaluate interrater agreement. Cohen’s kappa indicated a substantial, but not perfect, agreement (k = .71). To resolve disagreements, the first author checked all the included papers and discussed with the other authors to identify the category that best represented each paper. The last author further checked a random subset of papers as a means of further quality control.
Results
Research Designs
For ease of reading and interpretation, we grouped papers along the temporal axis in blocks of 5 years each, except for the last block (2020–2023), which includes four years. In general, as can be seen in the graph in Figure 1, the number of job insecurity articles has increased over the years, with a notable surge in such studies after 2010. The slight decrease in the last time period (2020–2023) is artificial, as it contains four instead of five years.
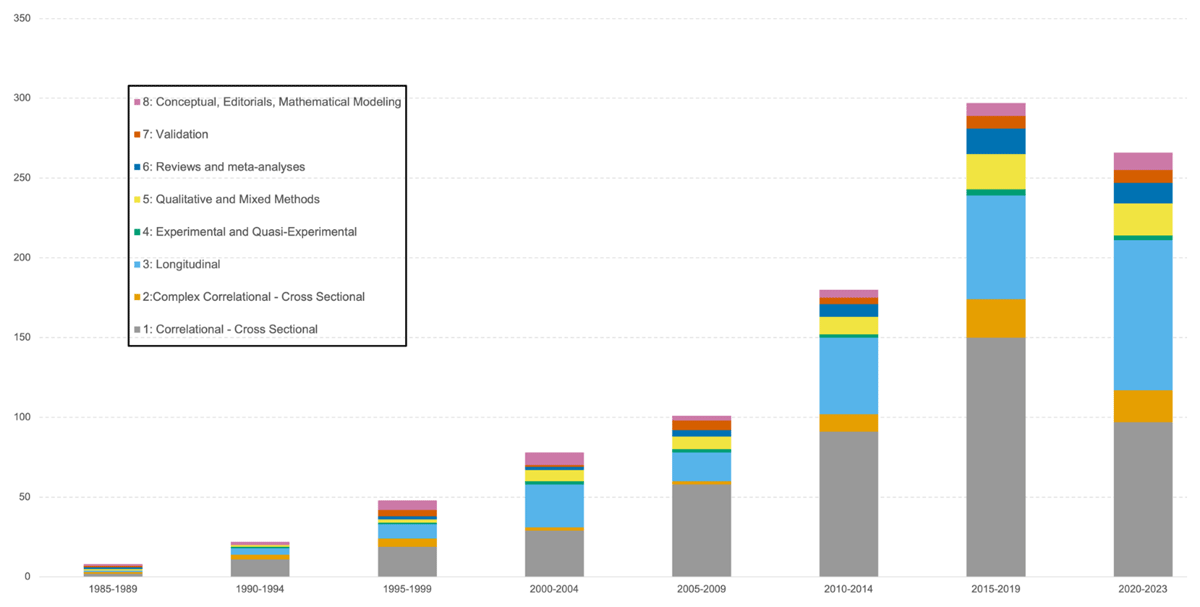
Figure 1
Temporal Trajectories of Research Designs in Job Insecurity Research.
Quantitative studies are much more numerous than qualitative or mixed-methods ones. Around 10% on average were qualitative compared to 90% of quantitative research, which aligns with Aguinis et al.’s (2009) contention that organisational psychology is mostly a quantitative discipline.
Table 1 provides a general overview of study types, frequencies, and percentages. Firstly, experimental and quasi-experimental studies are extremely limited in number, and the trend does not change over the years, making up an average of 1.5% of the study types. A significant number of designs (an average of 46%) are cross-sectional, showing an increasing trend over the years, reaching a peak of 57% in the five years 2005–2009. This percentage stabilises at about 50% in the subsequent decade, declining to 37% in the last four years. Longitudinal studies (including two-wave, follow-up studies, or broadly defined longitudinal studies) account for 27% of the total, with a distinctly upward trend in the last four years (2020–2023), reaching 35% of the total during this period. Since 2015, there has been an increase in study designs that, while classified as cross-sectional from a temporal perspective, increase in complexity. This is because they consider, for instance, nested data and data from multiple sources (including dyads). In the past decade, research employing these designs has stabilised between 7% and 8%. Qualitative studies or those using mixed methods constitute 7% of the total, a percentage that remains relatively stable over the years without significant variations.
Table 1
Summary of Research Designs by Years.
| RESEARCH DESIGN | 1984–1989 | 1990–1994 | 1995–1999 | 2000–2004 | 2005–2009 | 2010–2014 | 2015–2019 | 2020–2023 | GRAND TOTAL | |||||||||
|---|---|---|---|---|---|---|---|---|---|---|---|---|---|---|---|---|---|---|
| N | % | N | % | N | % | N | % | N | % | N | % | N | % | N | % | N | % | |
| 1. Correlational, Cross-sectional | 2 | 25 | 11 | 50.0 | 19 | 39.6 | 29 | 37.2 | 58 | 57.4 | 91 | 50.6 | 150 | 50.5 | 97 | 36.5 | 457 | 45.7 |
| 2. Complex Correlational, Cross-sectional | 1 | 13 | 3 | 13.6 | 5 | 10.4 | 2 | 2.6 | 2 | 2.0 | 11 | 6.1 | 24 | 8.1 | 20 | 7.5 | 68 | 6.8 |
| 3. Longitudinal | 1 | 13 | 4 | 18.2 | 9 | 18.8 | 27 | 34.6 | 18 | 17.8 | 48 | 26.7 | 65 | 21.9 | 94 | 35.3 | 266 | 26.6 |
| 4. Experimental | 0 | 1 | 4.5 | 1 | 2.1 | 2 | 2.6 | 2 | 2.0 | 2 | 1.1 | 4 | 1.3 | 3 | 1.1 | 15 | 1.5 | |
| 5. Qualitative and mixed methods | 1 | 13 | 1 | 4.5 | 2 | 4.2 | 7 | 9.0 | 8 | 7.9 | 11 | 6.1 | 22 | 7.4 | 20 | 7.5 | 72 | 7.2 |
| 6. Reviews and Meta-Analyses | 1 | 13 | 0.0 | 2 | 4.2 | 2 | 2.6 | 4 | 4.0 | 8 | 4.4 | 16 | 5.4 | 13 | 4.9 | 46 | 4.6 | |
| 7. Validation | 1 | 13 | 0.0 | 4 | 8.3 | 1 | 1.3 | 6 | 5.9 | 4 | 2.2 | 8 | 2.7 | 8 | 3.0 | 32 | 3.2 | |
| 8. Conceptual, Editorial, Mathematical modeling | 1 | 13 | 2 | 9.1 | 6 | 12.5 | 8 | 10.3 | 3 | 3.0 | 5 | 2.8 | 8 | 2.7 | 11 | 4.1 | 44 | 4.4 |
| Total for years | 8 | 100 | 22 | 100 | 48 | 100 | 78 | 100 | 101 | 100 | 180 | 100 | 297 | 100 | 266 | 100 | 1000 | 100 |
Measurement
We started from other sources (e.g., Fischmann et al., 2023; Shoss, 2017) to compile our list and added several entries based on our literature search (including papers coded as validation studies). We retrieved all full texts using library resources for subsequent analyses but identified several very similar versions of the same scales due to minor edits being made over time; in those cases, we chose to report those that seemed most representative.
A summary of key characteristics of the scales is presented in Table 2: type of study (validation or empirical study, including presenting an ad hoc scale); type of job insecurity that was measured (i.e., quantitative, qualitative, or both); dimension it refers to (i.e., cognitive, affective, or both); language the scale was validated in; number of items; type of response scale and its range; and overall readability (see footnote 2 for details). Out of the 35 scales we identified, 20 measure quantitative job insecurity, eight measure qualitative job insecurity, and seven measure both.
Table 2
Key Characteristics of Job Insecurity Scales.
| AUTHORS | TYPE OF JOB INSECURITY | DIMENSION(S) | LANGUAGE(S) | ITEMS | RATING SCALE | RANGE | EDUCATIONAL LEVEL | FLESCH READING EASE SCORE | TYPE OF STUDY |
|---|---|---|---|---|---|---|---|---|---|
| Caplan et al., 1975 | Both | Cognitive | English | 4 | Uncertainty | 1–5 | Middle School | 72.2 | Empirical |
| Johnson et al., 1984 | Quantitative | Affective | English | 7 | Agreement | 1–5 | Middle School | 86.7 | Validation |
| Oldham et al., 1986 | Quantitative | Affective | English | 10 | 1–7 | Middle School | 75.4 | Empirical | |
| Ashford et al., 1989 | Both | Both | English | 57 | Importance and likelihood | 1–5 | Middle School | 74.5 | Validation |
| Hartley et al., 1991 | Quantitative | Cognitive | Hebrew | 3 | Likelihood | 1–5 | Middle School | 77.2 | Empirical |
| Hartley et al., 1991 | Quantitative | Both | Duch | 3 | Likelihood | mixed | Middle School | 68.3 | Empirical |
| Hartley et al., 1991 | Quantitative | Both | English | 3 | Likelihood | 1–5 | Elementary School | 88.7 | Empirical |
| Borg & Elizur, 1992 | Both | Both | German | 9 | Agreement | 1–7 | Elementary School | 92.6 | Validation |
| Hellgren et al., 1999 | Quantitative | Both | Swedish | 4 | Agreement | 1–5 | Middle School | 71.3 | Validation |
| Hellgren et al., 1999 | Qualitative | Both | Swedish | 4 | Agreement | 1–5 | College | 34.4 | Validation |
| Mohr, 2000 | Quantitative | Cognitive | German | 1 | Probability | 1–5 | High School | 65.7 | Empirical |
| Mauno et al., 2001 (global scale only) | Quantitative | Cognitive | Finnish | 3 | Agreement | 1–5 | Middle School | 79.3 | Validation |
| Probst, 2003 | Quantitative | Both | English | 18 + 20 | Yes,?, No | 1–3 | High School | 60.6 | Validation |
| Sverke et al., 2004 | Quantitative | Both | Dutch, Italian, Swedish, Flemish | 5 | Agreement | 1–5 | Elementary School | 100 | Empirical |
| Probst, 2005 | Quantitative | Both | English, Chinese | 3 | Yes,?, No | 1–3 | High School | 69.1 | Validation |
| Francis & Barling, 2005 | Both | Both | English | 5 | Agreement | 1–5 | Elementary School | 94.6 | Empirical |
| C. Lee et al., 2008 | Both | Cognitive | English, Chinese | 25 | Importance and likelihood | 1–5 | High School | 62.9 | Validation |
| Chirumbolo & Areni, 2010 | Qualitative | Both | Italian | 5 | Agreement | 1–5 | College | 43 | Empirical |
| De Witte et al., 2010 | Qualitative | Cognitive | Dutch | 10 | Deterioration | 1–5 | College Graduate | 17.9 | Empirical |
| Huang et al., 2010 | Quantitative | Affective | Chinese | 7 | Agreement | 1–5 | High School | 69 | Validation |
| Staufenbiel & König, 2011 | Quantitative | Both | German | 7 | Agreement | 1–7 | Middle School | 86.4 | Validation |
| Arnold & Staffelbach, 2012 | Quantitative | Both | German, French | 3 | Intensity | 1–5 | Middle School | 89.1 | Empirical |
| Arnold & Staffelbach, 2012 | Qualitative | Cognitive | German, French | 7 | Intensity | 1–5 | College | 34.6 | Empirical |
| O’Neill & Sevastos, 2013 | Quantitative | Both | English | 7 | Agreement | 1–7 | High School | 69.8 | Validation |
| O’Neill & Sevastos, 2013 | Qualitative | Both | English | 7 | Agreement | 1–7 | Middle School | 75.9 | Validation |
| Pienaar et al., 2013 | Qualitative | Both | English | 8 | Agreement | 1–7 | Middle School | 72.2 | Validation |
| Vander Elst et al., 2014 | Quantitative | Both | Dutch, Spanish, Swedish, English | 4 | Agreement | 1–5 | Elementary School | 96.2 | Validation |
| Burr et al., 2019 | Both | Affective | German, French, English, Swedish, Spanish, Turkish | 2 + 3 | 1–100 | High School | 51.6 | Validation | |
| Blotenberg & Richter, 2020 | Qualitative | Both | Swedish | 11 | Agreement | 1–5 | High School | 68.6 | Validation |
| Brondino et al., 2020 | Qualitative | Both | Dutch, Italian | 8 | Agreement | 1–7 | High School | 69 | Validation |
| Wang et al., 2021 | Quantitative | Cognitive | Chinese | 15 | Agreement | 1–7 | High School | 60.3 | Validation |
| Fischmann et al., 2022 | Qualitative | Both | Romanian, Dutch | 4 | Agreement | 1–5 | Middle School | 83.9 | Validation |
| Van Hootegem et al., 2023 | Quantitative | Cognitive | Dutch | 1 | Agreement | 1–4 | High School | 61.3 | Empirical |
| Bazzoli & Probst, 2023a | Quantitative | Both | English | 9 + 9 | Agreement | 1–7 | High School | 50.9 | Validation |
Development over Time
We identified eight articles (some reporting more than one scale) published between 1975, when Caplan et al. (1975) published their report, and 2000. The focus seemed to be predominantly on quantitative job insecurity (seven scales) and scales measuring both quantitative and qualitative job insecurity (three scales; Ashford et al., 1989; Borg & Elizur, 1992; Hellgren et al., 1999). More than half of the scales did not distinguish between the affective and cognitive dimensions but included items that referred to both dimensions. Only two quantitative job insecurity scales comprised exclusively affective items (Hartley et al., 1991; Johnson et al., 1984) and one comprised exclusively cognitive items. The majority of these studies were conducted in the United States, two in Germany, one in Sweden, one in Israel, one in the Netherlands and one in England.
Nine studies were published between 2001 and 2010. The overall trend remained similar, with a predominance of new scales focused on quantitative job insecurity (five) or both constructs (three). However, in 2010, a multidimensional scale measuring solely qualitative job insecurity was introduced by De Witte et al. (2010). Following this article, there seems to have been a growing interest in qualitative job insecurity, as reflected in the subsequent introduction of new scales (before then, only one scale was validated; Hellgren et al., 1999). In this decade, there is not a particular focus on the affective dimension. Indeed, similar to the previous period, studies are evenly divided between those measuring the cognitive dimension and those considering both dimensions without distinguishing them. However, the study by Huang et al. (2010) stands out, specifically focusing on the affective dimension.
Some of the scales first validated during this period were shortened or edited versions of previously validated scales. This is the case with Probst’s scale (2003), Lee et al.’s (2008) scale, which is a revised version of Ashford et al.’s (1989) scale, and Chirumbolo and Areni’s (2010) scale, adapting Sverke et al.’s (2004) scale measuring quantitative job insecurity and Hellgren et al.’s (1999) scale measuring qualitative job insecurity. In most studies, the focus was not on validating new scales but on investigating the scales’ predictive validity using outcomes related to performance and well-being. The United States continues to play a significant role in these studies, but there is an increasing presence of North European countries such as Belgium, Sweden, and Finland. Three studies were also conducted in China, and two in Italy.
In the following decade, 2011–2020, eight articles were identified, presenting five new scales on quantitative job insecurity, four on qualitative job insecurity, and one measuring both. Seven were mostly shortened or slightly edited versions of existing scales in validation articles. This seems to be in contrast with trends from previous years, when most new scales or adaptations of existing scales were the result of usage in empirical studies, generating many ad hoc versions. Hence, this may indicate a greater focus on measurement and methodological issues during this period. Despite this, even in this period, no particular attention is given to the distinction between the cognitive and affective dimensions. Both dimensions are jointly considered in all studies except by Arnold and Staffelbach (2012) and the items on job insecurity from the Copenhagen Psychosocial Questionnaire (Burr et al., 2019), which explicitly focus on the affective dimension. As mentioned above, attention to qualitative job insecurity seemed to increase during this period, attempting to identify a multidimensional structure focused on specific aspects of one’s job. Similar to the previous decade, there is an increase in studies involving participants from different countries, particularly in the European context. There are no studies conducted in the United States; one was conducted in Australia and one was conducted in South Africa.
Last, four articles were found since 2021. Three focused on quantitative job insecurity and one on qualitative job insecurity. The methodological attention observed in the previous decade is confirmed, as three out of four studies are validations, including the validation of a shorter version of an existing instrument (Bazzoli & Probst, 2023a), an adaptation of an existing scale to the Chinese context (Wang et al., 2021), and the last, in contrast to the scales published in the previous decade, is a generic qualitative insecurity scale, without specific job-related aspects (Fischmann et al., 2022). Interestingly, only the paper by Van Hootegem et al. (2023) measured quantitative insecurity using a single item. Participants in these studies came from North European countries, China, and the United States. Even in this period, the question as to whether it is necessary to distinguish between the cognitive and affective dimensions remained open (Bazzoli & Probst, 2023a).
Properties of Measurement Scales
There appears to be no clear trend in terms of quantitative job insecurity or qualitative job insecurity concerning scale dimensions, as the two complementary approaches seem to be roughly equivalent in the literature: multidimensional scales accounted for 42% of published scales. However, most of these scales seem to refer to cognitive and affective quantitative job insecurity. Multidimensional qualitative job insecurity scales tend to focus on specific job characteristics; however, using these scales might be problematic because valuable job features are specified a priori and are assumed to be constant across contexts and time. For instance, some features currently very relevant for some workers, such as working remotely or flexible hours (Lee et al., 2023), are not considered in any existing scale. On the other hand, generic scales might not convey the same amount of information and be of limited practical value, as it is unknown unless further research is carried out on what job features workers are more worried about losing.
Validation studies have focused on shorter versions of existing scales in keeping with a larger movement towards shorter scales. Scales measuring qualitative job insecurity generally have fewer items on average (a mean of 6.7 items) compared with those related to quantitative job insecurity (a mean of 7.5 items). However, a single-item measure of quantitative job insecurity was used in two empirical studies, whereas the shortest scale measuring qualitative job insecurity has four items.
We analysed the scales’ readability using two indicators, namely the Flesch Reading Ease Score and the Flesch-Kincaid Grade Level.2 We could not calculate the indices for five of the scales because we could not retrieve the items. The Flesch Reading Ease Score for quantitative job insecurity scales varied between 50.9 and 100 (M = 75.56, SD = 13.53), whereas it varied between 68.6 and 89.1 for qualitative job insecurity scales (M = 75.68, SD = 8.65). In scales measuring both types of insecurity, the index varies from 51.6 to 94.6, with M = 75.24 and SD = 16.66. An index between 70 and 80 indicates that the items are reasonably easy to read. Overall, 48% of the scales were reasonably easy to read. In other words, job insecurity scales only require respondents to attain a modest level of education to understand the items, as items could be understood by participants that completed fifth grade (i.e., last year of elementary school; Flesch-Kincaid Grade Level: range = 0.4–7.6, M = 5, SD = 2.02). Similarly, scales measuring qualitative job insecurity were, on average, easy to read for respondents who graduated elementary school (Flesch-Kincaid Grade Level: range = 4.7–6.5, M = 5.47, SD = 0.77). Scales measuring both dimensions also required modest levels of education (Flesch-Kincaid Grade Level: range = 1.4–8.8, M = 4.74, SD = 2.67).
Sixty-six per cent of scales measured quantitative job insecurity, 75% measured qualitative job insecurity, and 33% of those measuring both types were associated with response options asking about participants’ agreement. Other domains used in quantitative job insecurity scales include probability, intensity, and presence. In contrast, scales measuring qualitative job insecurity were associated with response formats that asked about intensity and deterioration/improvement. Importance and likelihood response scales were also used in scales measuring both types. In most cases, 5- or 7-point rating scales were used, but we found 4-point rating scales and a 3-point scale (yes,?, no) that has since been revised to a more common 7-point rating scale.
Validation Analyses
Of the 35 scales identified in the literature, roughly half were presented in validation articles. The remaining scales were introduced in empirical articles, primarily ad hoc scales, to test theoretical models. In empirical studies that presented new or ad hoc scales, internal consistency indices (e.g., Cronbach’s alpha) were the only evidence of reliability presented (validity was not investigated) in 54% of cases. Factor structure was analysed via factor analytical models or by principal component analysis for the remaining scales. In two cases (Probst, 2003; Bazzoli & Probst, 2023a), analyses based on Item Response Theory were also conducted. In just over half of the studies (56%), convergent or discriminant validity was analysed, while around 70% of the scales also evaluated criterion validity (predictive or concurrent). Measurement invariance across time, samples, or demographic variables was included in 63% of the scales, time, samples, or socio-demographic variables.
Only a limited set of scales were available in more than a few languages: the job insecurity scale (Vander Elst, De Witte, et al., 2014) and the generic qualitative job insecurity scale (Fischmann et al., 2023) are both available in eight languages, and there is evidence to support their metric invariance across 10 countries (Jiang et al., in press); the job security index and job security satisfaction scales (Bazzoli & Probst, 2023a) are available in English, Italian, Chinese, Spanish, Turkish, Polish, Marathi and Afrikaans (Probst, personal communication); and the Copenhagen Psychosocial Questionnaire (Burr et al., 2019) is available in German, French, English, Swedish, Spanish, and Turkish.
Discussion
We reviewed research designs and measurement scales over the past 40 years of job insecurity research. Our analysis showed that overall, quantitative methods dominate the research landscape, providing further empirical evidence to support previous concerns that emerged from within the job insecurity literature (Bazzoli & Probst, 2022), as well as broader disciplinary issues (Aguinis et al., 2009; Bazzoli, 2022). In terms of measurement efforts, our analysis revealed various approaches to scale validation, some of which are more rigorous (resulting in better evidence supporting scales’ psychometric properties) than others (resulting in sparse or lower quality evidence supporting the continued use of a scale).
Recommendations to Strengthen Future Job Insecurity Research
We advance three overarching methodological recommendations and suggest unresolved methodological issues that merit more scholarly attention in future job insecurity research.
Align Research Design and Research Questions
Despite widespread use, cross-sectional designs that rely on self-reported data have been disfavoured in industrial and organisational psychology (Spector, 2019) and are sometimes banned from disciplinary journals. The reasoning goes that causal statements, or better, statements based on Granger causality (i.e., the notion that to establish causality, one must establish that two variables covary, that causes temporally precede effects, and that alternative explanations be ruled out) are inappropriate because temporal precedence cannot be established, and common method variance might inflate covariation (Spector, 2019). This has even been specifically stated about job insecurity research (e.g., Klandermans & Van Vuuren, 1999). However, the ability of longitudinal designs to support valid causal inference has also been overstated; in other words, ‘longitudinal data –on their own– do not justify causal inferences’ (Rohrer & Murayama, 2023, p. 3). Other designs, such as experiments (see Probst et al., 2007), offer credible causal interpretations and longitudinal designs are not immune from concerns related to confounding variables. Do not misinterpret our words: longitudinal data help to establish causal associations between variables but they are neither necessary nor sufficient (Rohrer & Murayama, 2023) to establish causality. We are not arguing that the field should revert to exclusively cross-sectional designs; we are cautioning against defaulting to longitudinal designs because of their (mis)perceived superiority. Below, we outline several assumptions on the most-used models and what they can control for.
The first task for applied researchers is clarifying whether they want to investigate contemporaneous or lagged causality, which can both be achieved using longitudinal data. If contemporaneous effects are of interest, a simple fixed effects model (assuming scores are correctly centred) can control for time-invariant confounders, whose effects do not change over time. For instance, investigating how negative industry-wide outlooks are related to immediate job searching behaviours (which credibly generated some level of job insecurity) using this type of model can help controlling for time-invariant confounders (e.g., personality, which is thought to be stable over time), but it does not help controlling for negative affect, which might be a time-variant confounder (i.e., it changes over time and it affects both predictor and outcome). This model fails when there is evidence of lagged causality and when people change over time differently. The estimates returned by this model are based only on subjects that do change throughout the study.
An alternative may be a cross-lagged model, which aims to identify lagged causal effects and can be used to investigate reciprocal effects. This model returns biased estimates if contemporaneous causal effects are at play and if either of the constructs included is trait-like in nature and is not able to control for time-invariant confounders. For instance, this model appears well-suited to investigate the lagged effect of job insecurity on workers’ mental health concerns (e.g., Bazzoli et al., 2023). Dynamic panel models similarly aim to identify lagged causal processes but do take into account the effect of time-invariant confounders (making similar assumptions on these confounders as the models described above).
Our analyses showed that research using longitudinal designs is on the rise (see Figure 2), which is a welcome development, but how can we make the most of longitudinal data? Instead of relying on methodological myths, we reiterate the recommendations first made by Rohrer and Murayama (2023): clarify what the goal of the analysis is (i.e., a well-defined research question that can be reasonably addressed); think about potential time-varying and time-invariant confounders, and which of them can be controlled for in the chosen statistical model, in addition to all other assumptions that are made; and, finally, correctly interpret the estimated effects.
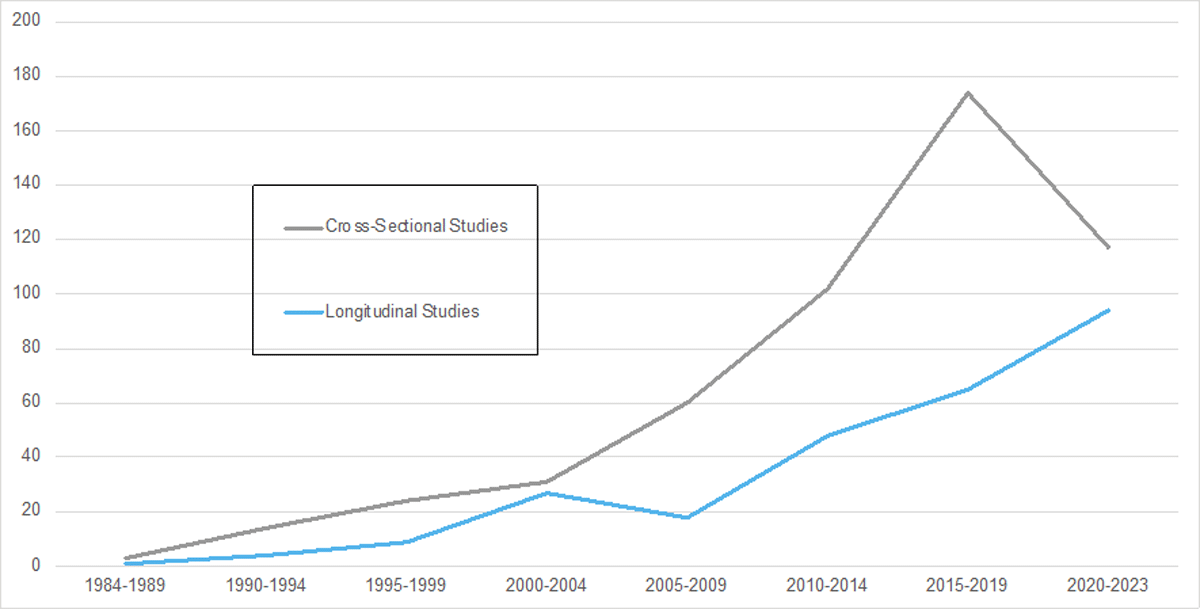
Figure 2
Comparison of Cross-Sectional and Longitudinal Designs across Time.
Regardless of the type of design chosen, we encourage scholars to provide a clear rationale that supports the chosen design and model (including time lag, if a longitudinal design is chosen) and which shows that, given assumptions and known constraints (e.g., sampling hard-to-reach populations), their design and model are well-suited to provide answers to their research questions.
Use Well-Validated Scales
Our analysis featured a variety of scales to measure job insecurity, each with its advantages and drawbacks. Disadvantages of specific types of scales (e.g., scales that measure constructs other than job insecurity; see Ashford et al., 1989) are discussed elsewhere and not repeated here (Fischmann et al., 2023). Instead, we focus on the need for more robust validation efforts: a substantial share of reviewed scales were only validated using a factor analytical model that provided rather limited evidence of construct validity. It bears repeating that although construct validity is relevant, it is hardly the only type that should be established.
We echo Kane (1992) in repeating that establishing the validity of scores consists of crafting an argument that supports the use of scores generated by a scale for a specified goal, and thus, validity arguments that are only based on a factor analytic model are insufficient (Bazzoli & French, 2025). In the past 40 years, scholars have developed a limited number of scales that underwent significant and rigorous analyses to evaluate their psychometric properties, which should be used on the grounds of clearer and more robust evidence to support their use moving forward. The proliferation of redundant measures is a significant threat to the credibility of job insecurity research (Elson et al., 2023) and should be addressed. For instance, three scales were validated in six or more languages (Bazzoli & Probst, 2023a; Burr et al., 2019; Fischmann et al., 2022; Jiang et al., in press; Probst, 2003; Vander Elst et al., 2014) and one more was validated in four languages (Sverke et al., 2004). Nonredundancy should be the guiding principle, as opposed to continuously developing scales whose validity has not been established, and already well-validated scales should be reused as much as is feasible.
More Qualitative and Mixed-Methods Research
It is well-known that most social sciences, including organisational sciences, are mostly quantitative, to the detriment of other types of research that are perceived as less valuable (Bazzoli, 2022). Others before us called for more qualitative and mixed-method designs in organisational research (Bartunek & Seo, 2002). In addition to complementing quantitative research, qualitative research can be used (and has been used) to challenge and to refine existing theories. For instance, Bazzoli and Probst (2023b) showed that some tenets of social exchange theory may not apply to vulnerable workers, as employers do not seem to reciprocate, which would be expected under the reciprocity rule within social exchange theory (Probst et al., 2021). Premji and Shakya (2017) argued that job insecurity research should include class, gender, race, and immigration in academic theories to develop an intersectional understanding of job insecurity. Further, workers might develop localised understandings of job insecurity and make sense of it in contextually relevant ways, driven partly by workers’ culture (Anderson & Pontusson, 2007; Jacobson, 1987; Pienaar et al., 2013). Consider Fligstein and Shin’s (2007) argument that most job features (e.g., stability, benefits, strong hiring practices) are more valued by lower-income workers, and therefore, a threat to these prized features should be more relevant to them, compared with higher-income workers. It could be that more economically vulnerable populations develop a different understanding of job insecurity, offering numerous opportunities to research how these localised understandings are developed, maintained, and reinforced.
Along similar lines, qualitative and mixed designs might help expand our understanding of other economic stressors that could be related to job insecurity as it is traditionally understood. Technology-related job insecurity (Lee et al., 2022) is a prime example, as technology is evolving rapidly, and a day when humans and robots collaborate in the workplace is becoming a reality.
Open Issues
Although the job insecurity field has made significant strides in the past 40 years, there remain some open issues. Below, we elaborate on a few of them as they pertain to the measurement of job insecurity in the years to come.
Single-Item Measurement
A word on single-item measurement is warranted. Measuring constructs using single-item measures (Matthews et al., 2022) is becoming more common. We believe it has value if the construct to be measured is unidimensional and likely to be interpreted in the same way across different populations. Unfortunately, job insecurity does not meet either of these criteria and is likely not an appropriate construct to be measured using single-item measures. The available single-item measures seem to measure only cognitive quantitative job insecurity, which is inadequate to represent the entirety of the construct’s space. Other issues arise around estimating constructs’ reliability coefficients and their use in common research scenarios. Using a single item makes estimating internal consistency reliability impossible, and other types of reliability (e.g., test-retest) might not be as straightforward to interpret, as the test-retest correlation coefficient might be influenced by (and might actually be a measure of) the construct’s stability over time. Second, unless we are willing to accept the assumption that job insecurity single items measure this construct without error, its use might be limited in path analytical models and in cross-cultural research. Correcting for attenuation (i.e., creating a latent factor with artificial reliability lower than one from a single item, for instance, 0.80) can only be accomplished in a structural equation modelling framework, and invariance across samples could be tested using Item Response Theory models, which are well developed in other disciplines (see, e.g., the literature on differential item functioning (DIF) in educational psychology).
We acknowledge that there are instances in which using multi-item measures is either impossible (e.g., research using data collected by government agencies) or impractical (e.g., concerns about response fatigue in daily diary studies); in these cases, we suggest researchers explicitly acknowledge they are measuring only a limited part of the construct’s space and provide as much evidence of construct validity as is feasible. This will inevitably rely on assumptions that cannot be empirically tested, which we believe are completely acceptable, but these assumptions should, at the very least, be reasonably grounded in previous empirical research and use sound logic.
Measuring Uncertainty vs. Lack of Certainty
Measuring uncertainty is no small feat. In this review, we took stock of job insecurity scholars’ design and measurement practices but much remains to be addressed. One of the most pressing issues is in ensuring that items measure job insecurity, as opposed to lack of job security. For instance, consider some items of the Job Security Index (JSI; Bazzoli & Probst, 2023a; Probst, 2003): endorsing strongly agree to items such as ‘unpredictable,’ ‘unknown,’ and ‘questionable’ reflects the belief that respondents do not know whether their job is secure, but it does not imply that their job is not secure. On the other hand, an item like ‘I am likely to lose my job’ would reflect more insecurity if respondents endorsed middle values, compared with lower scores that reflect more job security, and higher scores that reflect a greater certainty of job loss. Although these concepts may appear semantically close, the former reflects uncertainty and ambiguity about the continuance of one’s job in the future, and the latter reflects some degree of certainty that the job will not continue. Whether this distinction is a mere academic exercise or a meaningful difference to workers remains an open empirical and theoretical question related to scoring and interpreting scores generated from these scales.
Scales’ Readability
Our findings showed that some scales required a high level of reading ability, typically reached during the last years of high school or in college. This limits the potential populations to whom these scales can be meaningfully administered. The effect of administering a test that requires a higher reading ability than respondents possess might be severe. Insights from other psychological disciplines seem to point towards tailoring a test to respondents’ abilities; not doing so might result in validity concerns because if workers cannot understand the items due to insufficient reading skills, their answers may not accurately reflect the construct being measured, which in turn might lead to incorrect conclusions (Abedi, 2006; Kuncel & Hezlett, 2010). Systematic measurement bias might also result from administering a test that requires a certain level of reading skills to workers who do not possess them, impacting the test’s reliability and fairness (Camilli & Shepard, 1994). Hence, considering the potential issues outlined above, we suggest including readability analyses as part of routine tests before deploying a scale and providing evidence that the targeted population can accurately understand the items.
Multidimensional scales
Some of the scales we reviewed incorporate multiple subdimensions, which seems to happen more frequently in scales that measure qualitative job insecurity. However, earlier scales measuring quantitative job insecurity (e.g., Ashford et al., 1989) also adopted this approach. A key advantage of multidimensional scales includes improved validity (DeVellis, 2016) and their potential to support more targeted interventions based on subscale scores. However, in our experience, researchers often use aggregate scores rather than subdimension scores, which diminishes these benefits. Furthermore, using total scores assumes that all dimensions contribute equally to job insecurity perception. This assumption is difficult to validate empirically. For instance, adding another scale that measures the perceived importance of job features, in addition to a multidimensional qualitative job insecurity scale seems reasonable, but the question of how to make sense of these scores is more complex. Multiplying them to obtain a composite score is not recommended (Evans, 1991), but additive scores could be a potential way forward. A seldom recognised advantage of these scales might lie in investigating how threats to valued job features may evolve, perhaps in response to other life events (e.g., a threat to flexible work hours might be more salient when workers have caregiving responsibilities).
The use of unidimensional (and more general) scales raises questions about score interpretation, as items generally refer to ‘valued job features’ without further specification. It is thus unclear whether all workers perceive certain job features as equally relevant when answering the items. It is important to recognise that multidimensional scales, like those assessing job insecurity, often focus on different aspects, such as severity and probability of job loss (Greenhalgh & Rosenblatt, 1984; Hartley et al., 1991), rather than dimensions like cognitive vs. affective insecurity. These aspects—severity and probability—represent distinct elements of the threat of job loss, and distinguishing between them allows for a more nuanced understanding of job insecurity. However, as seen in scales like that of Lee et al. (2008), these aspects are often implicitly assessed through response scales rather than being treated as entirely separate dimensions. This distinction underscores the complexity of interpreting scores. It highlights the need to consider whether multidimensional (specific) or unidimensional (general) scales provide a more meaningful measure of job insecurity. This remains an empirical question that needs to be urgently addressed.
Implications and Limitations
Our review carries significant implications for both job insecurity research and practice. A heightened awareness of methodological choices and improved measurement practices is crucial for strengthening the validity and reliability of empirical findings in this field. Rigorous methodological approaches enhance scholars’ ability to draw accurate inferences, reducing potential biases and inconsistencies that have historically challenged job insecurity research (De Witte et al., 2016). More robust empirical evidence enables policymakers to develop interventions and labour policies that are firmly grounded in high-quality data and rigorous analytical techniques. Furthermore, by critically examining and addressing methodological shortcomings, this review contributes to the ongoing refinement of research practices, enhancing the field’s long-term credibility and impact (Shoss, 2017). As job insecurity continues to be a pressing concern in an evolving labour market, improving methodological rigour will be essential in shaping future scholarship and ensuring that empirical insights remain relevant and actionable over the next four decades.
To aid scholars in selecting an appropriate measurement scale, we created Table 3, which summarises scales that have been validated in at least two languages and that have substantial evidence to support their validity. What scale is best for a given research project will likely depend on design considerations and other constraints (e.g., time, sample makeup, response fatigue, and cultural context). However, we encourage scholars to use it as a comparison tool (in addition to Table 2, in which helpful information is reported, such as the reading difficulty of most scales) and as a starting point to reflect on the accumulated evidence supporting the scales’ validity. Doing so will assist them in choosing a theoretically solid, well-validated, and meaningful scale in their study context.
Table 3
Compendium of job insecurity scales.
| ORIGINAL SCALE | SIGNIFICANT DEVELOPMENTS/REFINEMENTS | OVERVIEW (ALL ARTICLES) | VALIDATED VERSIONS IN OTHER LANGUAGES |
|---|---|---|---|
| Ashford et al. (1989) |
| English, Chinese | |
| Borg (1992) |
| Chinese, German (items available in English) | |
| Hellgren et al. (1999) – Quantitative |
| Swedish, Italian, (items available in English) | |
| Hellgren et al. (1999) – Qualitative |
| Swedish, Italian (items available in English) | |
| De Witte (2000) – Quantitative |
| Duch, Spanish, Swedish, English, Chinese, Croatian, Greek, Lithuanian, Romanian, German (Switzerland) | |
| De Witte (2000) – Qualitative |
| Duch, English, Chinese, Croatian, Greek, Lithuanian, Romanian, German (Switzerland) | |
| Probst (2003) |
| English, Chinese, Italian, Afrikaans | |
| Hellgren et al., (2002) |
| Dutch, Italian, Swedish (items are available in English) | |
| Burr et al. (2019) |
| German, French, English, Swedish, Spanish, Turkish (items are available in English) | |
| Brondino et al. (2020) |
| Italian, Dutch (items are available in English) |
Although our review has merits, it is not without limitations. First, we limited our search to APA PsycInfo only; hence, we might have missed articles that appeared in journals that are not indexed in it. We also excluded papers that were not in English, which could have resulted in excluding scholarship published in other languages that might have been relevant for our analyses. This seems especially pertinent in the case of unpublished studies (e.g., theses and dissertations), the so-called ‘grey literature’. Data extraction errors and interpretation issues could have also occurred even though we had a robust process to extract and code the data.
Conclusion
In this article, we took stock of current research designs and measurement scales that investigated job insecurity over the past 40 years. In doing so, we critically reviewed trends in research designs and measurement scales. Based on this review, we advance several recommendations to increase the job insecurity field’s credibility and impact, and stress the need for research that uses qualitative and mixed-methods designs. We also outline several open issues to stimulate future research.
Notes
[1] Some articles included multiple studies. For simplicity, we only considered the study with higher internal validity (for example, a longitudinal study compared with a cross-sectional one, or an experimental or quasi-experimental study compared with a longitudinal one).
[2] The former reflects the approximate educational level a person will need to be able to read a particular text easily, ranging from 0 to 100, where 0 indicates that the item is very complex and difficult to understand and 100 indicates that it is easily understandable. The latter indicates the years of education needed to accurately understand a given item.
Competing Interests
The authors have no competing interests to declare.
Author Contributions
Andrea Bazzoli: Conceptualization, Data curation, Formal analysis, Supervision, Writing – original draft, Writing – review & editing.
Margherita Brondino: Conceptualization, Data curation, Formal analysis, Funding acquisition, Supervision, Writing – original draft, Writing – review & editing.
Ava Morgan: Formal analysis, Writing – original draft.
Jason Phillips: Formal analysis, Writing – original draft.
Margherita Pasini: Conceptualization, Data curation, Formal analysis, Funding acquisition, Supervision, Writing – original draft, Writing – review & editing.