
Table 1
Means, standard deviations, reliabilities, and correlations among study variables.
| VARIABLE | M | SD | 1 | 2 | 3 | 4 | 5 | 6 |
|---|---|---|---|---|---|---|---|---|
| 1. Gender (T1) | 0.52 | 0.50 | – | |||||
| 2. Career stage (T1) | 0.61 | 0.49 | 0.03 | – | ||||
| 3. Work hours (T1) | 44.30 | 9.83 | –0.21** | 0.09** | – | |||
| 4. Career adaptability (T1) | 4.93 | 0.59 | 0.07* | –0.03 | 0.10** | 0.93 | ||
| 5. Career insecurity (T2) | 4.06 | 1.22 | 0.10* | 0.08* | –0.04 | –0.17** | 0.81 | |
| 6. Exhaustion (T3) | 3.20 | 0.91 | 0.04 | –0.12* | 0.10* | –0.22** | 0.31** | 0.84 |
[i] Note. Career stage: 0 = no PhD, 1 = PhD; Gender: 0 = male, 1 = female; NT1 = 885; * p < 0.05; ** p < 0.01 (one-tailed).
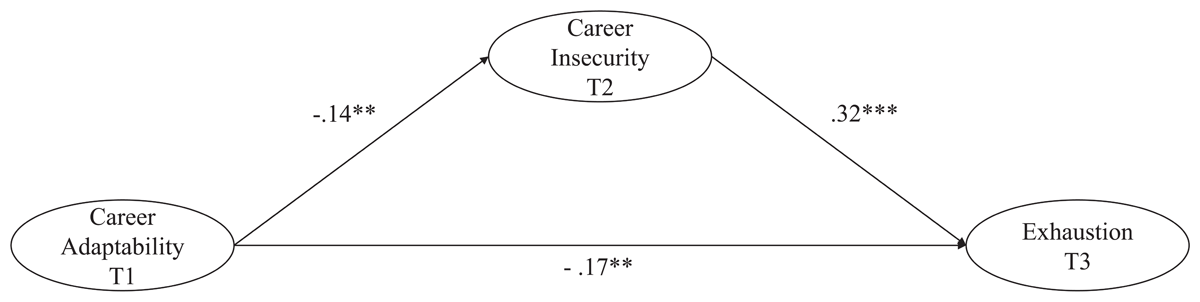
Figure 1
Effects of career adaptability on exhaustion via career insecurity.
Note: N = 885; *p < 0.05. **p < 0.01. *** p < 0.001. Standardized path estimates are reported. The indirect effect was significant β = –0.05, p = 0.015).