
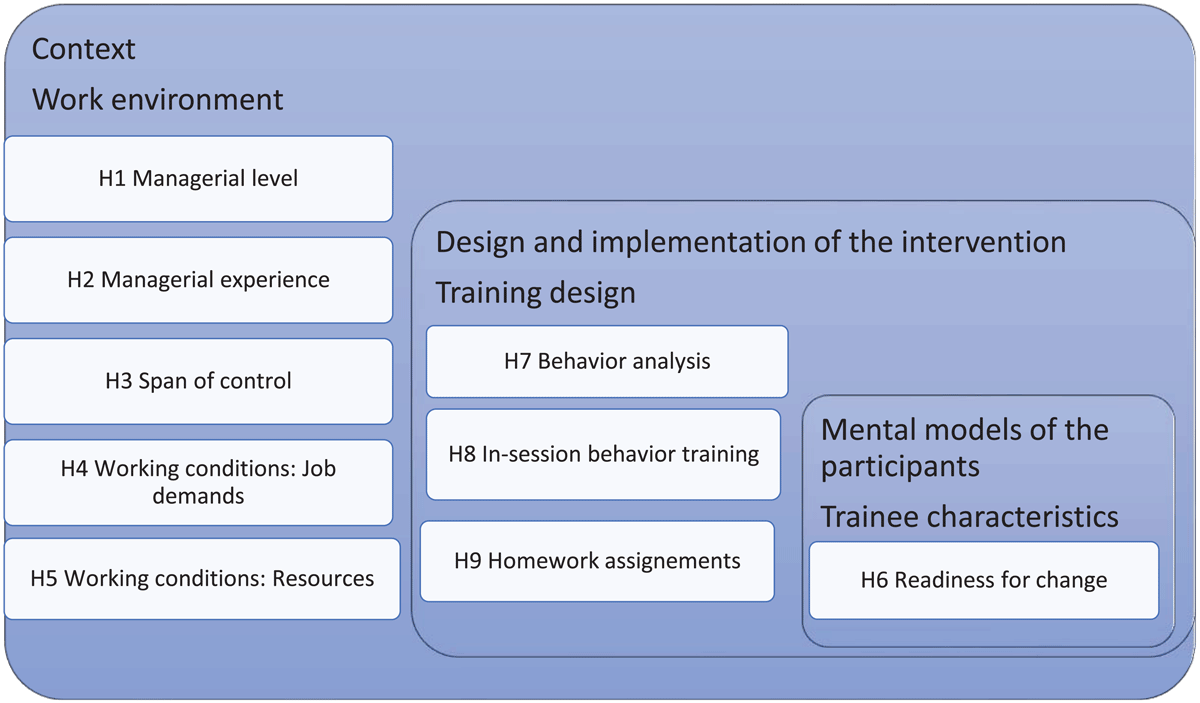
Figure 1
The present study hypotheses mapped on an integration of organizational intervention framework (Nielsen & Randall 2013) and training transfer theory (Baldwin & Ford 1988).
Table 1
Descriptive statistics and correlation between the predictor variables measuring the context of the intervention, the mental models of the participants, and the implementation of the intervention (n = 59).
| 1 | 2 | 3 | 4 | 5 | 6 | 7 | 8 | 9 | 10 | 11 | 12 | 13 | 14 | 15 | 16 | 17 | 18 | MIN | MAX | M | SD | ||
|---|---|---|---|---|---|---|---|---|---|---|---|---|---|---|---|---|---|---|---|---|---|---|---|
| 1 | Managerial level | 1.00 | 2.00 | 1.66 | 0.48 | ||||||||||||||||||
| 2 | Managerial experience | –.33* | 1.00 | 25.00 | 10.24 | 6.67 | |||||||||||||||||
| 3 | Span of control | .43** | –.23 | 2.00 | 49.00 | 14.73 | 10.42 | ||||||||||||||||
| 4 | Readiness for change | .31* | –.14 | .21 | 5.67 | 10.00 | 8.81 | 1.08 | |||||||||||||||
| 5 | Organizational stressors | –.02 | –.14 | –.12 | .17 | 1.33 | 5.00 | 3.29 | 0.78 | ||||||||||||||
| 6 | Role stressors | .03 | .03 | .04 | –.10 | .50** | 1.00 | 5.00 | 2.93 | 0.75 | |||||||||||||
| 7 | Subordinate stressors | –.10 | .18 | –.20 | –.08 | .34** | .15 | 1.00 | 5.00 | 3.79 | 0.65 | ||||||||||||
| 8 | Superior support | .00 | .06 | –.28* | –.23 | –.42** | –.51** | –.12 | 1.00 | 5.00 | 2.16 | 0.90 | |||||||||||
| 9 | Peer support | –.02 | .12 | –.25 | –.34** | –.44** | –.46** | –.13 | .65** | 1.00 | 4.00 | 2.09 | 1.01 | ||||||||||
| 10 | Behaviour analysis (manager) | –.02 | .03 | –.27* | –.02 | –.02 | .02 | .16 | –.04 | –.06 | 3.70 | 6.00 | 5.29 | 0.50 | |||||||||
| 11 | Behaviour analysis (trainer) | –.06 | .10 | –.14 | –.18 | –.13 | –.10 | .07 | .19 | .25 | .17 | 3.50 | 5.63 | 4.79 | 0.54 | ||||||||
| 12 | In-session behavior training (manager) | .06 | –.19 | –.07 | –.07 | –.05 | –.04 | .06 | .09 | –.04 | .59** | .17 | 1.00 | 6.00 | 4.83 | 1.13 | |||||||
| 13 | In-session behavior training (trainer) | –.03 | .02 | –.15 | –.18 | –.17 | –.24 | .14 | .27* | .32* | .09 | .80** | .24 | 3.08 | 6.00 | 4.79 | 0.61 | ||||||
| 14 | Homework planning (manager) | –.13 | –.08 | –.16 | .12 | .04 | .02 | .07 | –.06 | –.34** | .57** | .04 | .61** | .06 | 3.50 | 6.00 | 5.32 | 0.56 | |||||
| 15 | Homework planning (trainer) | .00 | –.07 | –.19 | –.11 | –.16 | –.19 | .02 | .31* | .19 | .12 | .68** | .18 | .66** | .25 | 3.60 | 6.00 | 5.06 | 0.58 | ||||
| 16 | Homework implementation (manager) | .14 | .08 | –.23 | .13 | .01 | .17 | .09 | –.12 | –.11 | .54** | .06 | .14 | –.04 | .38** | .11 | 2.75 | 6.00 | 4.61 | 0.67 | |||
| 17 | Homework implementation (trainer) | .00 | .05 | –.31* | –.07 | .09 | –.01 | .05 | .07 | .24 | .21 | .52** | .00 | .45** | .13 | .50** | .53** | 2.00 | 6.00 | 4.44 | 0.83 | ||
| 18 | Homework evaluation (manager) | –.08 | –.03 | –.16 | .22 | .16 | .07 | .15 | –.14 | –.20 | .72** | .04 | .60** | .06 | .63** | .05 | .40** | .09 | 4.20 | 6.00 | 5.32 | 0.51 | |
| 19 | Homework evaluation (trainer) | .00 | –.09 | –.08 | –.07 | –.10 | –.05 | –.01 | .07 | .19 | .14 | .67** | .30* | .67** | .28* | .64** | .22 | .67** | .24 | 2.20 | 5.60 | 4.63 | 0.68 |
[i] Note: *p < .05, **p < .01.
Table 2
Parameter estimates for the random components in the base models for leader performance.
| ESTIMATE | STD. ERROR | |
|---|---|---|
| Repeated measures (employees) | ||
| Variance T1 | 1.044 | 0.079 |
| Covariance T1–T2 | 0.805 | 0.072 |
| Variance T2 | 1.056 | 0.082 |
| Managerial level | ||
| Intercept variance | 0.359 | 0.098 |
| Slope variance | 0.020 | 0.022 |
Table 3
Effect for leader performance of contextual variables. The testing of hypothesis was based on the moderation effects; a significant moderation effect indicates that the change in leadership performance from pre- to post-interventions was dependent on the level of the predictor variable.
| PREDICTOR VARIABLE | MAIN EFFECT | MODERATION EFFECT | ||||||||
|---|---|---|---|---|---|---|---|---|---|---|
| ESTIMATE | STD. ERROR | df | t | p | ESTIMATE | STD. ERROR | df | t | p | |
| Managerial level | 0.149 | 0.206 | 66.545 | 0.720 | 0.474 | –0.053 | 0.095 | 47.569 | –0.557 | 0.580 |
| Managerial experience | –0.011 | 0.015 | 64.369 | –0.748 | 0.457 | 0.004 | 0.007 | 48.448 | 0.602 | 0.550 |
| Span of control | 0.007 | 0.009 | 61.298 | 0.728 | 0.470 | –0.005 | 0.004 | 60.683 | –1.139 | 0.259 |
| Readiness for change | 0.054 | 0.089 | 59.289 | 0.605 | 0.548 | 0.078 | 0.038 | 43.105 | 2.041 | 0.047 |
| Organizational stressors | 0.142 | 0.120 | 57.694 | 1.180 | 0.243 | –0.028 | 0.057 | 43.497 | –0.504 | 0.617 |
| Role stressors | 0.074 | 0.127 | 59.072 | 0.582 | 0.563 | –0.154 | 0.060 | 42.901 | –2.584 | 0.013 |
| Subordinate stressors | 0.440 | 0.146 | 73.421 | 3.013 | 0.004 | 0.024 | 0.078 | 51.722 | 0.315 | 0.754 |
| Superior support | –0.132 | 0.105 | 61.104 | –1.253 | 0.215 | 0.117 | 0.054 | 59.628 | 2.177 | 0.033 |
| Peer support | –0.137 | 0.094 | 61.006 | –1.460 | 0.149 | 0.085 | 0.043 | 46.389 | 1.974 | 0.054 |
Table 4
Effect for leader performance of intervention activities. The testing of hypothesis was based on the moderation effects; a significant moderation effect indicates that the change in leadership performance from pre- to post-interventions was dependent on the level of the predictor variable.
| PARAMETER | MAIN EFFECT | MODERATION EFFECT | ||||||||
|---|---|---|---|---|---|---|---|---|---|---|
| ESTIMATE | STD. ERROR | df | t | p | ESTIMATE | STD. ERROR | df | t | p | |
| Behaviour analysis (manager) | 0.167 | 0.184 | 58.099 | 0.908 | 0.368 | 0.132 | 0.084 | 43.275 | 1.571 | 0.124 |
| Behaviour analysis (trainer) | 0.212 | 0.171 | 57.834 | 1.240 | 0.220 | 0.042 | 0.078 | 42.302 | 0.534 | 0.596 |
| In-session behavior training (manager) | 0.097 | 0.088 | 67.058 | 1.098 | 0.276 | 0.044 | 0.041 | 56.242 | 1.065 | 0.291 |
| In-session behavior training (trainer) | 0.067 | 0.157 | 59.841 | 0.423 | 0.674 | 0.049 | 0.072 | 41.996 | 0.687 | 0.496 |
| Homework planning (manager) | 0.216 | 0.170 | 59.535 | 1.266 | 0.210 | 0.034 | 0.078 | 41.080 | 0.433 | 0.667 |
| Homework planning (trainer) | 0.159 | 0.168 | 60.449 | 0.946 | 0.348 | –0.018 | 0.078 | 42.195 | –0.234 | 0.816 |
| Homework implementation (manager) | –0.002 | 0.168 | 59.513 | –0.014 | 0.988 | –0.037 | 0.076 | 44.837 | –0.489 | 0.627 |
| Homework implementation (trainer) | 0.030 | 0.132 | 54.606 | 0.224 | 0.823 | –0.022 | 0.058 | 34.924 | –0.384 | 0.704 |
| Homework evaluation (manager) | 0.270 | 0.183 | 55.567 | 1.476 | 0.146 | 0.116 | 0.085 | 44.513 | 1.372 | 0.177 |
| Homework evaluation (trainer) | 0.019 | 0.137 | 54.719 | 0.138 | 0.891 | –0.047 | 0.063 | 41.749 | –0.739 | 0.464 |
Appendix 1
Questionnaire items for managers’ demands and resources, managers’ readiness for change, and evaluation of intervention activities assessed by managers and trainers.
| VARIABLE | ITEM | RESPONSE RANGE |
|---|---|---|
| Managerial job demands | ||
| Organizational stressors | Your operation does not have the resources to cope with peak loads | 1–5 |
| You are unable to work according to your own judgement because of decisions made by superiors, politicians, or authorities | 1–5 | |
| You need to explain and justify ‘bad’ or ‘negative’ decisions made by superiors | 1–5 | |
| Role stressors | Having to work overtime or take work home | 1–5 |
| Tension between administrative work, business development, and contact with employees | 1–5 | |
| My responsibilities and mission as a manager are clear and defined (Reversed scored) | 1–5 | |
| Subordinate stressors | There are cooperation problems or conflicts between subordinates | 1–5 |
| Problems with security and mutual trust within the team | 1–5 | |
| Subordinates not working in the way you have agreed | 1–5 | |
| You feel that subordinates are working against you | 1–5 | |
| Subordinates have insufficient structure in their work | 1–5 | |
| Insufficient professional competence of subordinates | 1–5 | |
| Managerial resources | ||
| Superior support | Superiors show real interest in what I do and the problems I have as a manager | 1–5 |
| I trust superiors to help me, if necessary, to find a work situation that I can cope with | 1–5 | |
| Your superior manager’s requirements and expectations of you are unclear (Reversed scored) | 1–5 | |
| Your boss ignores your views and overrules you (Reversed scored) | 1–5 | |
| Peer Support | I can get good support from manager colleagues when needed | 1–5 |
| I have good opportunities to discuss and reason with manager colleagues about the operation | 1–5 | |
| Readiness for change | ||
| Change commitment | How important is it for you to develop as a manager? | 0–10 |
| Change efficacy | How much do you think you can succeed in developing as a manager within the framework of this leadership training? | 0–10 |
| Change effort | How willing are you to invest in this right now? | 0–10 |
| Assessment of intervention activities by managers | ||
| Behavior analysis | I have been supported in analyzing how I act (behave) in my leadership | 1–6 |
| I have been supported in examining how my leadership behaviors can change | 1–6 | |
| In-session behavior training | I have been supported in practicing behavioral changes through exercises | 1–6 |
| Any exercises during the session had a clear purpose | 1–6 | |
| These exercises have been relevant for developing my functional leadership behaviours | 1–6 | |
| Homework planning | I have been supported in concretizing one or more homework assignments that I will carry out before the next session | 1–6 |
| The homework assignment is clearly formulated in writing | 1–6 | |
| The homework assignment is relevant to my leadership | 1–6 | |
| Homework implementation | I have completed the homework as planned | 1–6 |
| Homework evaluation | I have been supported in evaluating how the homework functioned | 1–6 |
| Assessment of intervention activities by trainers | ||
| Behavioral analysis | I as a trainer have supported the client in analysing how he/she acts (behaves) in his/her leadership | 1–6 |
| I as a trainer have supported the client in examining how his/her leadership behavior can be changed | 1–6 | |
| In-session behavioral training | I as a trainer have supported the client in practicing behavioural changes through exercises | 1–6 |
| Any exercises during the session had a clear purpose | 1–6 | |
| These exercises have been relevant to developing the client’s functional leadership behaviors | 1–6 | |
| Homework planning | I as a trainer have supported the client in concretizing one or more homework assignments to be completed before the next counseling session | 1–6 |
| The homework assignment is clearly formulated in writing | 1–6 | |
| The homework assignment is relevant to the client’s leadership | 1–6 | |
| Homework implementation | The client has completed the homework assignment as planned | 1–6 |
| Homework evaluation | I as a trainer have supported the client in evaluating how the homework functioned | 1–6 |
Appendix 2
Questionnaire items for leadership performance, assessed by the employees of the participating managers.
| FACET | ITEM | RESPONSE RANGE |
|---|---|---|
| Leadership effectiveness | Is effective in representing our organization | 1–7 |
| Is effective in doing his/her job | 1–7 | |
| Is effective in making employees perform efficiently | 1–7 | |
| Is effective in leading employees | 1–7 | |
| Employee engagement | Makes employees exceed expectations | 1–7 |
| Makes employees want to succeed in my work | 1–7 | |
| Makes employees want to perform efficiently | 1–7 | |
| Employee satisfaction | Leads the activities for which he/she is responsible in a satisfactory way | 1–7 |
| Works with employees in a satisfactory way | 1–7 |
[i] Rate how frequently your manager accomplishes the following outcomes.
1 = never, 2 = almost never, 3 = occasionally, 4 = sometimes, 5 = often, 6 = almost always, and 7 = always.