
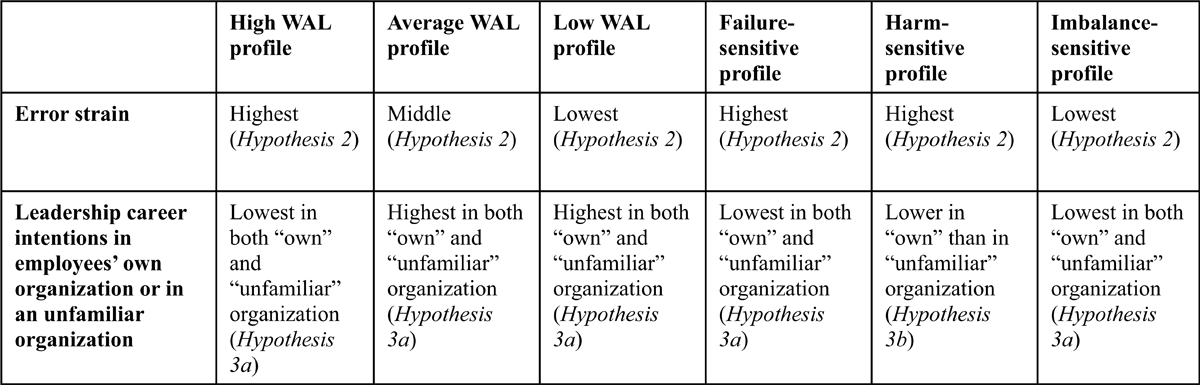
Figure 1
An overview of the study hypotheses about the relationships of six WAL profiles with error strain and leadership career intentions.
Table 1
Means, standard deviations, reliability coefficients, and Pearson intercorrelations among study variables.
| 1. | 2. | 3. | 4. | 5. | M | SD | α | |
|---|---|---|---|---|---|---|---|---|
| 1. Worries about failure | 1 | 2.26 | 0.88 | 0.85 | ||||
| 2. Worries about work-life imbalance | .29*** | 1 | 2.83 | 1.08 | 0.81 | |||
| 3. Worries about harm | .59*** | .29*** | 1 | 2.03 | 0.55 | 0.68 | ||
| 4. Error strain | .60*** | .18*** | .35*** | 1 | 2.68 | 0.92 | 0.86 | |
| 5. Leadership career intention in own organization | –.06 | –.03 | .01 | –.03 | 1 | 2.18 | 1.15 | |
| 6. Leadership career intention in unfamiliar organization | –.11*** | –.08* | –.08** | –.03 | .43*** | 2.40 | 1.22 |
[i] Note: α = Cronbach’s alpha.
Table 2
Fit indices for the Worries About Leadership (WAL) profiles based on Latent Profile Analysis.
| NUMBER OF CLASSES | LOG L | ENTROPY | ABIC | LMR | LATENT CLASS PROPORTIONS N (%) |
|---|---|---|---|---|---|
| 1 | –3794.671 | – | 7611.475 | – | 955 (100) |
| 2 | –3557.669 | 0.705 | 7152.227 | 0.0000 | 624 (65)/334 (35) |
| 3 | –3443.154 | 0.723 | 6937.909 | 0.0000 | 410 (43)/399 (42)/146 (15) |
| 4 | –3423.796 | 0.720 | 6913.936 | 0.0233 | 404 (42)/330 (35)/145 (15)/76 (8) |
| 5 | –3390.349 | 0.761 | 6861.785 | 0.0002 | 360(38)/344 (36)/104 (11)/86 (9)/61 (6) |
| 6 | –3381.320 | 0.747 | 6858.470 | 0.0229 | 350 (37)/320 (34)/104 (11)/86 (9)/61 (6)/34 (4) |
| 7 | –3374.858 | 0.770 | 6860.288 | 0.0177 | 363 (38)/316 (33)/98 (10)/86 (9)/44 (5)/28 (3)/20 (2) |
| 8 | –3361.358 | 0.787 | 6848.032 | 0.5959 | 263 (28)/248 (25)/184(19)/88 (9)/61 (6)/48 (5)/35 (4)/28 (3) |
| 9 | –3356.009 | 0.735 | 6852.076 | 0.7230 | 291 (30)/243 (25)/ 105 (11)/96 (10)/77 (8)/76 (8)/32 (3)/22 (2)/13 (1) |
[i] Notes: Log L = Log Likelihood, aBIC = sample-size adjusted Bayesian information criterion, LMR = Lo–Mendell–Rubin test.
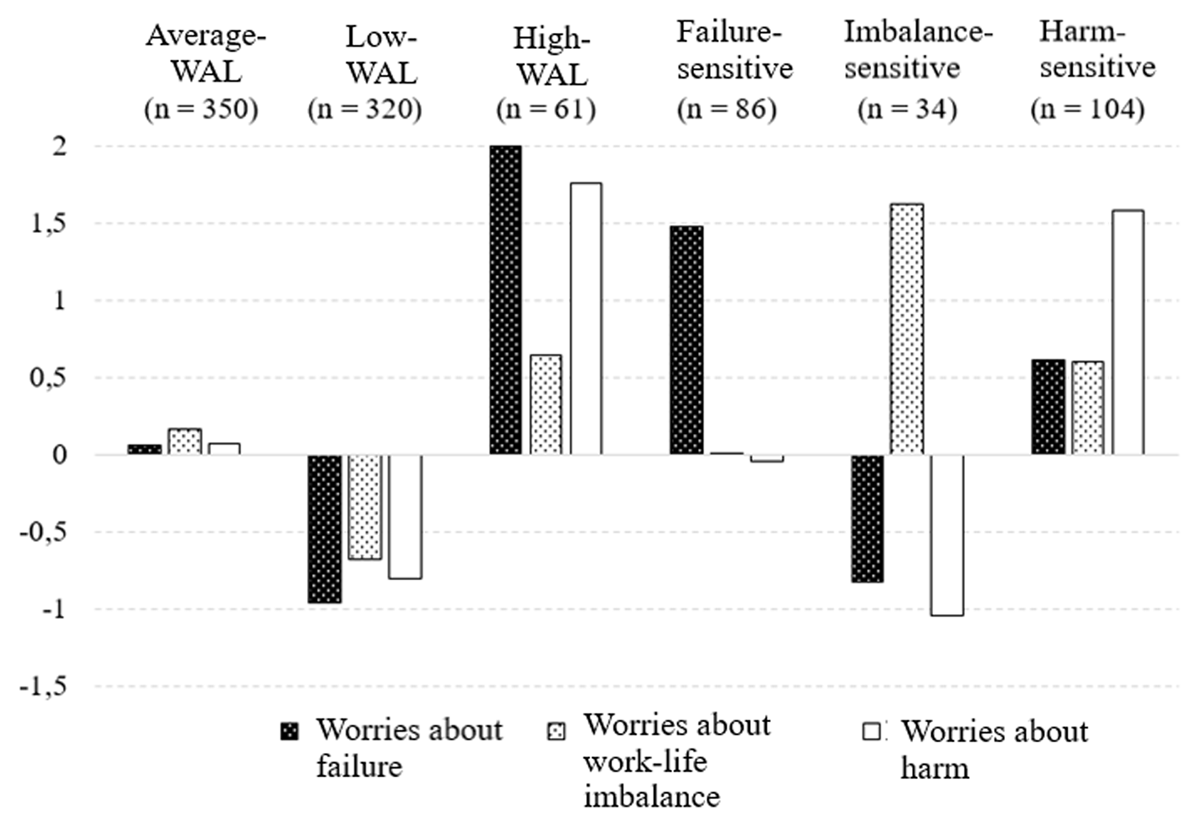
Figure 2
Worries About Leadership (WAL) profiles (presented as standardized z-scores to help interpretation).
Table 3
Differences in Worries about leadership (WAL) dimensions among six profiles based on Latent Profile Analysis.
| 1.AVERAGE WAL | 2.LOW WAL | 3.HIGH WAL | 4.FAILURE-SENSITIVe | 5.IMBALANCE-SENSITIVE | 6.HARM-SENSITIVE | F | PAIRWISE COMPARISONSa | |
|---|---|---|---|---|---|---|---|---|
| (N = 350) M (SD) | (N = 320) M (SD) | (N = 61) M (SD) | (N = 86) M (SD) | (N = 34) M (SD) | (N = 104) M (SD) | |||
| Worries about failure | 2.34(0.40) | 1.36(0.38) | 4.15(0.45) | 3.66(0.34) | 1.50(0.44) | 2.85(0.44) | 875.26*** | 3 > 4 > 6 > 1, 2, 5 2 > 1 |
| Worries about work-life imbalance | 3.01(0.90) | 2.13(0.76) | 3.50(1.08) | 2.85(0.99) | 4.52(0.39) | 3.46(0.80) | 91.04*** | 5 > 1, 2, 3, 4, 6 3, 6 > 1, 2, 4 1, 4 > 2 |
| Worries about harm | 2.08(0.40) | 1.43(0.38) | 3.33(0.46) | 2.00(0.39) | 1.25(0.25) | 3.21(0.39) | 507.70*** | 3, 6 > 1, 2, 4, 5 1, 4 > 2, 5 |
[i] * p < 0.05; ** p < 0.01; *** p < 0.001.
a Bonferroni comparisons.
Table 4
Differences in gender, family-related factors, employment type and professional group (%) between the WAL profiles.
| AVERAGE WAL | LOW WAL | HIGH WAL | FAILURE-SENSITIVE | IMBALANCE-SENSITIVE | HARM-SENSITIVE | ALL PARTICIPANTS | χ2 | |
|---|---|---|---|---|---|---|---|---|
| (N = 350) | (N = 320) | (N = 61) | (N = 86) | (N = 34) | (N = 104) | (N = 955) | ||
| % within pattern (% of total N = 955) | ||||||||
| Gender | 18.65** | |||||||
| Female | 53.1 (19.5) | 50.6AT(17.0) | 63.9 (4.1) | 73.3T (6.6) | 67.6 (2.4) | 54.8 (6.0) | (55.5) | |
| Male | 46.9 (17.2) | 49.4T (16.5) | 36.1 (2,3) | 26.7AT (2.4) | 32.4 (1.2) | 45.2 (4.9) | (44.5) | |
| Relationship status | 12.10* | |||||||
| Living with a spouse | 78.9 (29.1) | 78.0 (26.1) | 62.1AT (3.8) | 72.1 (6.5) | 79.4 (2.8) | 83.7 (9.2) | (77.5) | |
| Living without spouse | 21.1 (7.8) | 22.0 (7.4) | 37.9T (2.3) | 27.9 (2.5) | 20.6 (0.7) | 16.3 (1.8) | (22.5) | |
| Children under 18 years | 23.92*** | |||||||
| No | 60.9AT (22.4) | 72.3T (24.2) | 75.9 (4.6) | 65.1 (5.9) | 38.2AT (1.4) | 64.4 (7.1) | (65.6) | |
| Yes | 39.1T (14.4) | 27.7AT (9.3) | 24.1 (1.5) | 34.9 (3.2) | 61.8T (2.2) | 35.6 (3.9) | (34.4) | |
| Employment type | 19.41* | |||||||
| Regular employment | 67.1 (24.6) | 69.7 (23.4) | 62.3 (4.0) | 53.5AT (4.8) | 73.5 (2.6) | 57.7 (6.3) | (65.7) | |
| Temporary employment | 24.9 (9.1) | 23.8 (8.0) | 26.2 (1.7) | 39.5T (3.6) | 17.6 (0.6) | 37.5T (4.1) | (27.0) | |
| Self-employed | 8.0 (2.9) | 6.6 (2.2) | 11.5 (0.7) | 7.0 (0.6) | 8.8 (0.3) | 4.8 (0.5) | (7.3) | |
| Occupational background | 26.01* | |||||||
| Professors | 6.0 (2.2) | 11.9T (4.0) | 3.3 (0.2) | 4.7 (0.4) | 8.8 (0.3) | 6.7 (0.7) | (7.9) | |
| Researchers and teachers | 49.4 (18.1) | 49.1 (16.4) | 63.9T (4.1) | 58.1 (5.2) | 35.3 (1.3) | 58.7 (6.4) | (51.5) | |
| Business school graduates | 22 (8.1) | 20.6 (6.9) | 14.8 (0.9) | 17.4 (1.6) | 23.5 (0.8) | 12.5AT (1.4) | (19.7) | |
| Academic engineers | 22.6 (8.3) | 18.4 (6.2) | 18.0 (1.2) | 19.8 (1.8) | 32.4 (1.2) | 22.1 (2.4) | (20,9) | |
[i] * p < 0.05; ** p < 0.01; *** p < 0.001.
T = typical (adjusted residual > 1.96), AT = atypical (adjusted residual < 1.96).
Table 5
Mean differences in error strain and leadership career intentions between the WAL profiles (ANCOVA).
| 1.AVERAGE WAL | 2.LOW WAL | 3.HIGH WAL | 4.FAILURE-SENSITIVE | 5.IMBALANCE-SENSITIVE | 6.HARM-SENSITIVE | F | PAIRWISE COMPARISONSa | PARTIAL η2 | |
|---|---|---|---|---|---|---|---|---|---|
| (N = 350) M (SE) | (N = 320) M (SE) | (N = 61) M (SE) | (N = 86) M (SE) | (N = 34) M (SE) | (N = 104) M (SE) | ||||
| Error strain | 2.68(0.04) | 2.16(0.04) | 3.56(0.10) | 3.58(0.08) | 2.32(0.13) | 2.98(0.08) | 67.83*** | 3, 4 > 1, 2, 5, 6 6 > 1, 2, 5 1 > 2 | 0.29 |
| Leadership career intention | |||||||||
| Own organization | 2.33(0.06) | 2.24(0.06) | 1.86(0.15) | 1.84(0.12) | 2.04(0.19) | 2.17(0.11) | 3.96*** | 1 > 4 | 0.02 |
| Unfamiliar organization | 2.37(0.06) | 2.68(0.06) | 1.85(0.14) | 1.93(0.12) | 2.00(0.19) | 2.37(0.11) | 11.12*** | 2 > 1 > 3, 4 2 > 5 | 0.06 |
[i] * p < 0.05; ** p < 0.01; *** p < 0.001.
a Bonferroni comparisons.
Table 6
Differences in leadership career intentions in current versus unfamiliar organization within each WAL profile (paired sample t-test).
| OWN ORGANIZATION M (SD) | UNFAMILIAR ORGANIZATION M (SD) | T | DF | |
|---|---|---|---|---|
| Average WAL | 2.35 (1.17) | 2.45 (1.16) | -1.48 ns | 349 |
| Low WAL | 2.12 (1.16) | 2.54 (1.29) | -5.52*** | 319 |
| High WAL | 1.90 (1.16) | 1.90 (1.14) | .00 ns | 60 |
| Failure-sensitive | 1.93 (1.00) | 2.10 (1.14) | -1.52 ns | 85 |
| Imbalance-sensitive | 2.09 (1.06) | 2.06 (0.95) | .177 ns | 33 |
| Harm-sensitive | 2.17 (1.12) | 2.42 (1.20) | -2.09* | 103 |
[i] * p < 0.05; ** p < 0.01; *** p < 0.001, ns non-significant.