
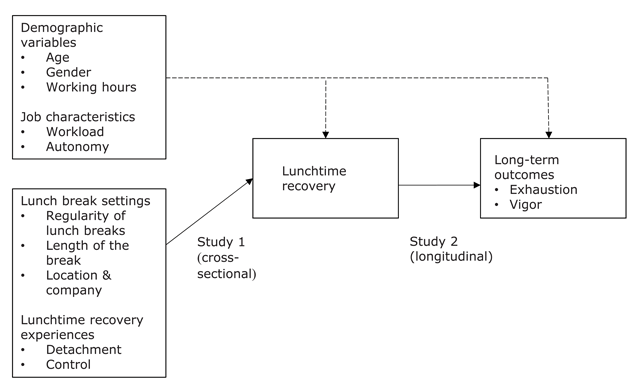
Figure 1
Model of the study.
Table 1
Means, standard deviations, and zero-order correlations of the study variables in Study 1.
| M / % | SD | 1 | 2 | 3 | 4 | 5 | 6 | 7 | 8 | 9 | 10 | 11 | |
|---|---|---|---|---|---|---|---|---|---|---|---|---|---|
| 1. Lunchtime recovery | 3.42 | 0.97 | – | ||||||||||
| 2. Age | 48.13 | 10.02 | .04 | – | |||||||||
| 3. Gender1 | 58.6% | – | .03 | .04 | – | ||||||||
| 4. Weekly working hours | 38.65 | 5.90 | –.03 | –.06 | .07* | – | |||||||
| 5. Workload | 3.82 | 0.79 | –.12*** | –.07 | –.15*** | .27*** | – | ||||||
| 6. Autonomy | 3.20 | 0.80 | .33*** | –.06 | .16*** | .05 | –.24*** | – | |||||
| 7. Regularity of lunch breaks2 | 86.2% | – | .21*** | –.13*** | –.04 | .04 | –.05 | .10** | – | ||||
| 8. Length of lunch break | 29.02 | 8.55 | .16*** | –.05 | .11** | –.02 | –.05 | .06 | .08* | – | |||
| 9. Lunch break outside3 | 36.9% | – | .17*** | –.04 | .11** | .12** | .08* | .14*** | .15*** | .15*** | – | ||
| 10. Lunch break with others4 | 71.4% | – | .08* | –.09** | –.13*** | .03 | .02 | .05 | .21*** | .07* | .12** | – | |
| 11. Detachment at lunch break | 3.33 | 1.06 | .59*** | .01 | .01 | –.09* | –.16*** | .18*** | .21*** | .18*** | .19*** | .03 | – |
| 12. Control at lunch break | 4.27 | 0.96 | .30*** | .03 | .11** | .03 | –.05 | .38*** | .05 | .19*** | .22*** | .05 | .24*** |
[i] Note. 1Gender: 1 = female, 2 = male; 2Regularity of lunch breaks: 0 = occasionally (1–3 times a week), 1 = regularly (4–5 times a week); 3Break outside: 0 = no (hardly ever or once a week), 1 = yes (2–5 times a week); 4Break with others: 0 = no (hardly ever or once a week), 1 = yes (2–5 times a week).
The second column shows percentages for categorical variables: 1% of female participants; 2% of participants taking lunch breaks regularly; 3% of participants typically spending lunch breaks outside; 4% of participants typically spending lunch breaks with others.
* p < .05; ** p < .01; *** p < .001; 807 < N < 841.
Table 2
Means, standard deviations, and zero–order correlations of the study variables in Study 2.
| M / % | SD | 1 | 2 | 3 | 4 | 5 | 6 | 7 | 8 | 9 | |
|---|---|---|---|---|---|---|---|---|---|---|---|
| 1. Lunchtime recovery T1 | 3.39 | 1.00 | |||||||||
| 2. Age T1 | 47.13 | 10.02 | .08* | ||||||||
| 3. Gender1 | 58.6% | – | .01 | .04 | |||||||
| 4. Weekly working hours T1 | 39.09 | 5.94 | –.09* | –.01 | .06 | ||||||
| 5. Workload T1 | 3.89 | 0.82 | –.16*** | .03 | –.16*** | .28*** | |||||
| 6. Autonomy T1 | 3.18 | 0.82 | .30*** | –.08* | .16*** | .05 | –.30*** | ||||
| 7. Exhaustion T1 | 1.92 | 1.45 | –.41*** | .04 | –.11** | .12** | .36*** | –.35*** | |||
| 8. Vigor T1 | 4.53 | 1.21 | .43*** | .01 | –.06 | .05 | .01 | .26*** | –.45*** | ||
| 9. Exhaustion T2 | 1.92 | 1.41 | –.35*** | –.02 | –.15*** | .08* | .31*** | –.30*** | .69*** | –.35*** | |
| 10. Vigor T2 | 4.37 | 1.32 | .36*** | .00 | –.09** | .07 | .04 | .19*** | –.37*** | .68*** | –.45*** |
[i] Note. 1Gender: 1 = female, 2 = male.
The second column shows percentages for categorical variables: 1% of female participants.
* p < .05; ** p < .01; *** p < .001; 785 < N < 841.
Table 3
Results of hierarchical regression analysis for lunchtime recovery (Study 1), N = 774.
| Lunchtime recovery | |||
|---|---|---|---|
| Step 1 | Step 2 | Step 3 | |
| Predictors | β | β | β |
| Age | .06 | .09* | .06* |
| Gender1 | –.03 | –.04 | –.03 |
| Weekly working hours | –.04 | –.05 | .00 |
| Workload | –.04 | –.04 | .01 |
| Autonomy | .33*** | .30*** | .22*** |
| Regularity of lunch breaks2 | .15*** | .07* | |
| Length of lunch break | .11** | .03 | |
| Lunch break outside3 | .11** | .01 | |
| Lunch break with others4 | –.00 | .02 | |
| Detachment at lunch break | .51*** | ||
| Control at lunch break | .09** | ||
| ΔR2 | .12*** | .06*** | .24*** |
| R2 | .12*** | .17*** | .41*** |
[i] Note. 1Gender: 1 = female, 2 = male; 2Regularity of lunch breaks: 0 = occasionally (1–3 times a week), 1 = regularly (4–5 times a week); 3Break outside: 0 = no (hardly ever or once a week), 1 = yes (2–5 times a week); 4Break with others: 0 = no (hardly ever or once a week), 1 = yes (2–5 times a week).
* p < .05; ** p < .01; *** p < .001.
Table 4
Results of hierarchical regression analysis for exhaustion (Model 1) and vigor (Model 2) at T2 (Study 2), N = 745.
| Model 1 Exhaustion | Model 2 Vigor | |||||
|---|---|---|---|---|---|---|
| Step 1 | Step 2 | Step 3 | Step 1 | Step 2 | Step 3 | |
| Predictors at T1 | β | β | β | β | β | β |
| Dependent variable at T11 | .68*** | .65*** | .63*** | .69*** | .68*** | .64*** |
| Age T1 | –.04 | –.03 | –.03 | –.04 | ||
| Gender2 | –.07* | –.07* | –.05 | –.05 | ||
| Weekly working hours T1 | –.02 | –.02 | .04 | .05 | ||
| Workload T1 | .05 | .06 | .02 | .03 | ||
| Autonomy T1 | –.03 | –.02 | .03 | .01 | ||
| Lunchtime recovery T1 | –.07* | .10** | ||||
| ΔR2 | .47*** | .01** | .003* | .47*** | .01 | .01** |
| R2 | .47*** | .48*** | .48*** | .47*** | .48*** | .49*** |
[i] Note. 1Dependent variable at T1: For the first model Exhaustion at T1, for the second model Vigor at T1. 2Gender: 1 = female, 2 = male.
* p < .05; ** p < .01; *** p < .001.