
Table 1
Means (M), standard deviations (SD), and zero-order correlations of the study variables (N = 109).
| Variables | M | SD | 1 | 2 | 3 | 4 | 5 | 6 |
|---|---|---|---|---|---|---|---|---|
| 1. Sex a) | ||||||||
| 2. Ageb) | –0.03 | |||||||
| 3. Type of contract c) | –0.09 | 0.28** | ||||||
| 4. Illegitimate tasks (t1) | 2.60 | 0.71 | –0.22* | 0.06 | 0.05 | |||
| 5. Qualitative job insecurity (t1) | 2.97 | 0.42 | –0.10 | 0.17 | 0.09 | 0.24* | ||
| 6. Musculoskeletal pain (t1) | 1.80 | 0.69 | –0.19* | 0.07 | –0.09 | 0.24* | 0.24* | |
| 7. Musculoskeletal pain (t2) | 1.85 | 0.71 | –0.28** | 0.05 | –0.02 | 0.30** | 0.33*** | 0.75*** |
[i] a) 1 = female, 2 = male.
b) 1 = 20–35 years, 2 = 36–50 years, 3 = 51–65 years.
c) 1 = temporary employment, 2 = permanent employment.
* p < 0.05, ** p < 0.01, *** p < 0.001 (two-tailed).
Table 2
Effect of illegitimate tasks (t1) on musculoskeletal pain (t2).
| Basic model | Model with covariates | |||||||||
|---|---|---|---|---|---|---|---|---|---|---|
| Est. | S.E. | Std. Est. | C.R. | 95% CI | Est. | S.E. | Std. Est. | C.R. | 95% CI | |
| Illegitimate tasks (t1) | 0.13 | 0.06 | 0.13 | 2.10* | [0.022, 0.268] | 0.11 | 0.06 | 0.11 | 1.73† | [–0.001, 0.245] |
| Musculoskeletal pain (t1) | 0.74 | 0.07 | 0.72 | 11.31*** | [0.593, 0.867] | 0.73 | 0.07 | 0.71 | 11.04*** | [0.573, 0.853] |
| Sex a) | –0.17 | 0.09 | –0.12 | –1.85† | [–0.347, 0.018] | |||||
| Age b) | –0.01 | 0.06 | –0.01 | –0.22 | [–0.119, 0.105] | |||||
| Type of contract c) | 0.05 | 0.11 | 0.03 | 0.45 | [–0.175, 0.267] | |||||
[i] Note. Bootstrap samples for percentile bootstrap confidence intervals (CI): 10,000. Level of bias corrected confidence intervals: 95% (two-tailed).
Abbreviation: Est. = unstandardized coefficient; Std. Est. = standardized coefficient; S.E. = standard error; C.R. = critical ratio (Est./S.E.); 95% CI = 95% confidence interval of unstandardized coefficients; a) 1 = female, 2 = male; b) 1 = 20–35 years, 2 = 36–50 years, 3 = 51–65 years; c) 1 = temporary employment, 2 = permanent employment.
† p < 0.10, * p < 0.05, ** p < 0.01, *** p < 0.001.
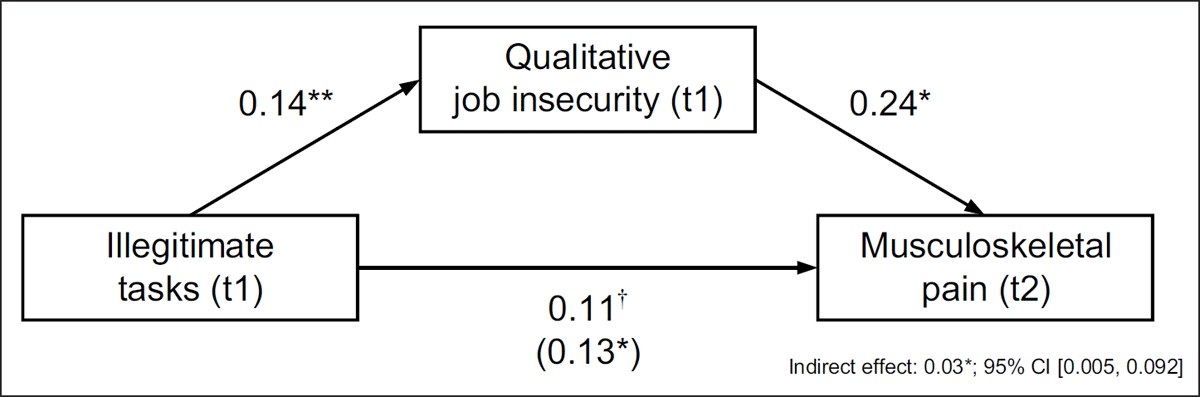
Figure 1
Indirect effect of qualitative job insecurity (t1) between illegitimate tasks (t1) and musculoskeletal pain (t2) controlling for musculoskeletal pain at baseline (unstandardized coefficients).
†p < 0.10, *p < 0.05, **p < 0.01, ***p < 0.001 (two-tailed), N = 109, Bootstrap sample size = 10,000.
Table 3
Indirect effect of qualitative job insecurity (t1) between illegitimate tasks (t1) and musculoskeletal pain (t2).
| Main effects | Basic model | Model with covariates | ||||||||
|---|---|---|---|---|---|---|---|---|---|---|
| Est. | S.E. | Std. Est. | C.R. | CI 95% | Est. | S.E. | Std. Est. | C.R. | CI 95% | |
| Illegitimate tasks (t1) → Musculosk. pain (t2) | 0.11 | 0.06 | 0.11 | 1.66† | [–0.007, 0.237] | 0.08 | 0.06 | 0.09 | 1.32 | [–0.032, 0.217] |
| Illegitimate tasks (t1) → Qual. job insecurity (t1) | 0.14 | 0.06 | 0.24 | 2.61** | [0.022, 0.258] | 0.14 | 0.06 | 0.24 | 2.61** | [0.023, 0.258] |
| Qual. job insecurity (t1) → Musculosk. pain (t2) | 0.24 | 0.11 | 0.14 | 2.22* | [0.059, 0.429] | 0.24 | 0.11 | 0.14 | 2.24* | [0.048, 0.429] |
| Musculosk. pain (t1) → Musculosk. pain (t2) | 0.71 | 0.07 | 0.71 | 10.94*** | [0.566, 0.839] | 0.70 | 0.07 | 0.69 | 10.68*** | [0.553, 0.826] |
| Sexa) → Musculosk. pain (t2) | –0.17 | 0.09 | –0.12 | –1.87† | [–0.345, 0.028] | |||||
| Ageb) → Musculosk. pain (t2) | –0.03 | 0.06 | –0.03 | –0.51 | [–0.137, 0.092] | |||||
| Type of contractc) → Musculosk. pain (t2) | 0.04 | 0.11 | 0.02 | 0.34 | [–0.187, 0.256] | |||||
| Indirect effect via Qual. job insecurity (t1) | Est. | S.E. | Std. Est. | p | CI 95% | Est. | S.E. | Std. Est. | p | CI 95% |
| Illegitimate tasks (t1) on musculosk. pain (t2) | 0.03 | 0.02 | 0.04 | 0.016 | [0.005, 0.092] | 0.03 | 0.02 | 0.04 | 0.018 | [0.005, 0.093] |
[i] Note. Bootstrap samples for percentile bootstrap confidence intervals (CI): 10,000. Level of bias corrected confidence intervals: 95% (two-tailed).
Abbreviation: Est. = unstandardized coefficient; Std. Est. = standardized coefficient; S.E. = standard error; C.R. = critical ratio (Est./S.E.); 95% CI = 95% confidence interval of unstandardized coefficients; a) 1 = female, 2 = male; b) 1 = 20–35 years, 2 = 36–50 years, 3 = 51–65 years; c) 1 = temporary employment, 2 = permanent employment.
† p < 0.10, * p < 0.05, ** p < 0.01, *** p < 0.001.
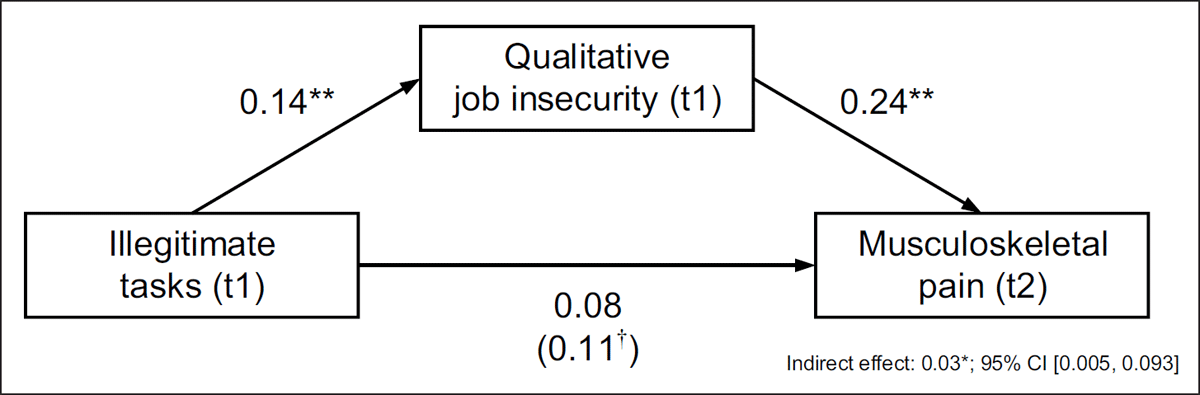
Figure 2
Indirect effect of qualitative job insecurity (t1) between illegitimate tasks (t1) and musculoskeletal pain (t2) controlling for musculoskeletal pain at baseline, sex, age, and type of contract (unstandardized coefficients).
†p < 0.10, *p < 0.05, **p < 0.01, ***p < 0.001 (two-tailed), N = 109, Bootstrap sample size = 10,000.