
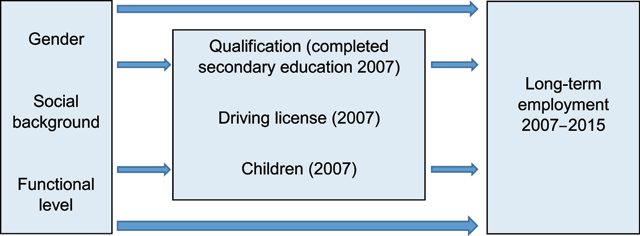
Figure 1
The assumed relationship between six covariates and long-term employment.
Table 1
Bivariate analysis: Percentage of former students who were long-term employed 2007–15 (n = 253).
| Covariates | Values | Long-term employed (%) | n | |
|---|---|---|---|---|
| Gender | 0. Women | 55 | 96 | |
| 1. Men | 73 | ** | 157 | |
| Functional level (secondary school) | 0. Fourth quartile (lowest level) | 45 | 47 | |
| 1. First to the third quartile | 71 | *** | 206 | |
| Social background | 0. Low | 67 | 176 | |
| 1. High | 66 | 77 | ||
| Qualification (completed secondary education 2007) | 0. No qualification | 49 | 109 | |
| 1. Academic or vocational qualification | 80 | *** | 144 | |
| Driver’s license (2007) | 0. No driver’s license | 45 | 67 | |
| 1. Driver’s license | 74 | *** | 186 | |
| Children (2007) | 0. No children | 60 | 101 | |
| 1. Children | 76 | * | 152 | |
[i] + p < 0.10; * p < 0.05; ** p < 0.01; *** p < 0.001.
Table 2
Logistic regression: How different covariates influence the long-term employment of former students who started upper secondary education with special educational needs. Odds ratios*.
| Independent variables | Odds ratios | ||||||
|---|---|---|---|---|---|---|---|
| All (n = 253) | Females (n = 96) | Males (n = 157) | |||||
| Gender | 0. Women | ||||||
| 1. Men | 2.2 | * | |||||
| Functional level | 0. Fourth quartile | ||||||
| (secondary school) | 1. First to the third quartile | 1.7 | 2.0 | 1.6 | |||
| Social background | 0. Low | ||||||
| 1. High | 1.0 | 0.8 | 1.1 | ||||
| Qualification (completed | 0. No qualification | ||||||
| secondary education 2007) | 1. Academic or vocational | 3.2 | *** | 3.7 | ** | 3.0 | ** |
| Driver’s license (2007) | 0. No driver’s license | ||||||
| 1. Driver’s license | 1.8 | + | 0.9 | 3.3 | ** | ||
| Children (2007) | 0. No children | ||||||
| 1. Children | 1.8 | + | 1.4 | 2.6 | + | ||
| Nagelkerke R Square | 0.24 | 0.18 | 0.25 | ||||
[i] + p < 0.10; * p < 0.05; ** p < 0.01; *** p < 0.001. For each independent variable, the value 0 is the reference category.
* The dependent variable is defined in this way: 0 = not long-term employed; 1 = long-term employed.