
Table 1
Educational level by disability status and age group. Source: EU-SILC 2014, Norway, Statistics Norway.
| Educational level | Non-disabled | Disabled | All | |
|---|---|---|---|---|
| 16–24 years | Compulsory (1–10 yrs) | 56,7% | 53,6% | 56,5% |
| Upper secondary (11–13 yrs) | 32,8% | 35,1% | 32,9% | |
| Tertiary, undergrad. (14–17 yrs) | 10,4% | 11,3% | 10,4% | |
| Tertiary, grad + postgrad (18+) | 0,2% | 0,0% | 0,2% | |
| N(=100%) | 2296 | 194 | 2490 | |
| 25–34 years | Compulsory (1–10 yrs) | 19,0% | 32,0% | 20,1% |
| Upper secondary (11–13 yrs) | 32,0% | 37,2% | 32,4% | |
| Tertiary, undergrad. (14–17 yrs) | 33,5% | 24,2% | 32,7% | |
| Tertiary, grad + postgrad (18+) | 15,5% | 6,5% | 14,7% | |
| N(=100%) | 2417 | 231 | 2648 | |
| 35–44 years | Compulsory (1–10 yrs) | 12,1% | 28,5% | 14,7% |
| Upper secondary (11–13 yrs) | 39,1% | 42,7% | 39,7% | |
| Tertiary, undergrad. (14–17 yrs) | 35,2% | 24,6% | 33,6% | |
| Tertiary, grad + postgrad (18+) | 13,5% | 4,2% | 12,1% | |
| N(=100%) | 2639 | 480 | 3119 | |
| 45–54 years | Compulsory (1–10 yrs) | 17,6% | 32,5% | 20,2% |
| Upper secondary (11–13 yrs) | 48,4% | 44,3% | 47,7% | |
| Tertiary, undergrad. (14–17 yrs) | 25,0% | 19,9% | 24,1% | |
| Tertiary, grad + postgrad (18+) | 9,0% | 3,3% | 8,0% | |
| N(=100%) | 2554 | 542 | 3096 | |
| 55–66 years | Compulsory (1–10 yrs) | 17,3% | 25,5% | 19,1% |
| Upper secondary (11–13 yrs) | 52,6% | 53,7% | 52,8% | |
| Tertiary, undergrad. (14–17 yrs) | 22,6% | 16,8% | 21,3% | |
| Tertiary, grad + postgrad (18+) | 7,5% | 4,0% | 6,8% | |
| N(=100%) | 2787 | 792 | 3579 | |
| All | Compulsory (1–10 yrs) | 23,7% | 31,0% | 24,8% |
| Upper secondary (11–13 yrs) | 41,4% | 45,7% | 42,1% | |
| Tertiary, undergrad. (14–17 yrs) | 25,6% | 19,5% | 24,7% | |
| Tertiary, grad + postgrad (18+) | 9,3% | 3,8% | 8,4% | |
| N(=100%) | 12693 | 2239 | 14932 |
Table 2
Labour force status by educational level and disability status. Source: EU-SILC 2014 Norway, Statistics Norway.
| 16–66 years | Compulsory (1–10 yrs) | Upper secondary (11–13 yrs) | Tertiary, undergrad. (14–17 yrs) | Tertiary, grad.+postgrad (18+) | All | |
|---|---|---|---|---|---|---|
| Non-disabled | Inactive | 24,7% | 12,3% | 6,8% | 2,5% | 12,9% |
| Employed | 67,3% | 85,3% | 91,0% | 95,8% | 83,5% | |
| Unemployed | 8,0% | 2,4% | 2,2% | 1,7% | 3,6% | |
| (N = 100%) | 3011 | 5260 | 3246 | 1176 | 12693 | |
| Disabled | Inactive | 52,1% | 40,7% | 27,5% | 16,5% | 40,7% |
| Employed | 41,1% | 56,9% | 68,9% | 81,2% | 55,3% | |
| Unemployed | 6,8% | 2,3% | 3,7% | 2,4% | 4,0% | |
| (N = 100%) | 693 | 1024 | 437 | 85 | 2239 | |
| 16–44 years | ||||||
| Non-disabled | Inactive | 26,7% | 10,6% | 4,9% | 1,2% | 12,6% |
| Employed | 63,0% | 85,8% | 92,0% | 96,7% | 82,1% | |
| Unemployed | 10,3% | 3,6% | 3,2% | 2,0% | 5,2% | |
| (N = 100%) | 2081 | 2558 | 1977 | 736 | 7352 | |
| Disabled | Inactive | 42,9% | 27,9% | 19,9% | 0,0% | 30,3% |
| Employed | 47,3% | 68,8% | 76,0% | 94,3% | 63,9% | |
| Unemployed | 9,8% | 3,3% | 4,1% | 5,7% | 5,9% | |
| (N = 100%) | 315 | 359 | 196 | 35 | 905 | |
| 45–66 years | ||||||
| Non-disabled | Inactive | 20,2% | 14,0% | 9,9% | 4,5% | 13,3% |
| Employed | 76,8% | 84,8% | 89,5% | 94,3% | 85,3% | |
| Unemployed | 3,0% | 1,2% | 0,6% | 1,1% | 1,4% | |
| (N = 100%) | 930 | 2702 | 1269 | 440 | 5341 | |
| Disabled | Inactive | 59,8% | 47,7% | 33,6% | 28,0% | 47,8% |
| Employed | 36,0% | 50,5% | 63,1% | 72,0% | 49,5% | |
| Unemployed | 4,2% | 1,8% | 3,3% | 0,0% | 2,7% | |
| (N = 100%) | 378 | 665 | 241 | 50 | 1334 |
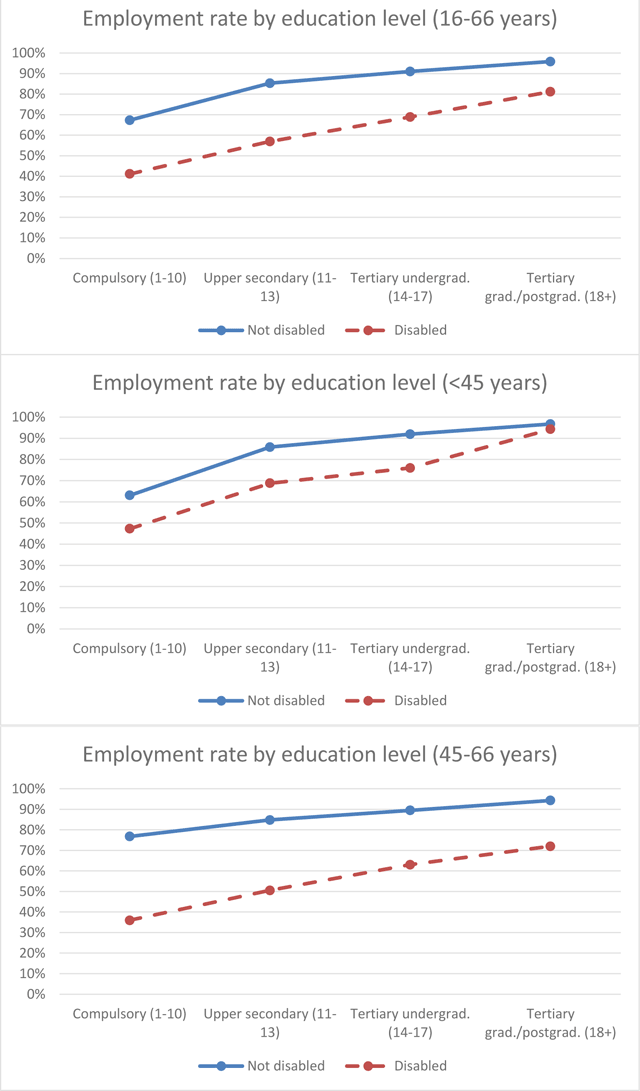
Figure 1
Employment rate by educational level and disability status. Source: EU-SILC 2014 Norway, Statistics Norway.
Table 3
Increase in the employment rate by educational level and disability status. Source: EU-SILC 2014 Norway, Statistics Norway.
| 16–44 years | 45–66 years | |||||
|---|---|---|---|---|---|---|
| Upper sec. | Tertiary undergrad | Upper sec. | Tertiary undergrad | |||
| vs | vs | vs | vs | |||
| Compulsory | Compulsory | Upper sec. | Compulsory | Compulsory | Upper sec. | |
| Per cent differences (percentage points): | ||||||
| Non-disabled | 22,8% | 28,9% | 6,1% | 8,1% | 12,7% | 4,7% |
| Disabled | 21,5% | 28,7% | 7,2% | 14,5% | 27,1% | 12,5% |
| Disabled compared to non-disabled: | 0,9 | 1,0 | 1,2 | 1,8 | 2,1 | 2,7 |
| Comparison 1: %-diff as proportional improvement from lower educational level: | ||||||
| Non-disabled | 0,36 | 0,46 | 0,07 | 0,10 | 0,17 | 0,06 |
| Disabled | 0,45 | 0,61 | 0,10 | 0,40 | 0,75 | 0,25 |
| Disabled compared to non-disabled: | 1,3 | 1,3 | 1,5 | 3,9 | 4,5 | 4,5 |
| Comparison 2: employment rate as proportional improvement from lower educational level: | ||||||
| Non-disabled | 1,36 | 1,46 | 1,07 | 1,10 | 1,17 | 1,06 |
| Disabled | 1,45 | 1,61 | 1,10 | 1,40 | 1,75 | 1,25 |
| Disabled compared to non-disabled: | 1,1 | 1,1 | 1,0 | 1,3 | 1,5 | 1,2 |
| Comparison 3: %-diff as proportional realisation of potential for «full employment» (100%): | ||||||
| Non-disabled | 0,62 | 0,78 | 0,43 | 0,35 | 0,55 | 0,31 |
| Disabled | 0,41 | 0,54 | 0,23 | 0,23 | 0,42 | 0,25 |
| Disabled compared to non-disabled: | 0,7 | 0,7 | 0,5 | 0,7 | 0,8 | 0,8 |