
1. Introduction
How do we choose our mode of transport in the city? Are our decisions based on comfort and travel time, or do less rational factors come into play? Empirical research suggests that choices are also influenced by the attractiveness of the route (Wee 2016), social interactions during the trip (Cox et al. 2006), bus cleanliness (Broome et al. 2010), clarity of transfer information (Jamei et al. 2022), and the sense of freedom while traveling (Friman and Olsson 2023).
Mobility drives social and economic interactions, but lack of access to transport leads to exclusion and harms well-being (Lucas et al. 2019; Verlinghieri and Schwanen 2020). People with mobility disabilities (PMDs) face additional barriers, making them particularly vulnerable (Mwaka et al. 2024; Sze and Christensen 2017). This study explores how perceived accessibility influences their transport choices in a multimodal environment: fixed-route bus, paratransit, car, and micromobility (small vehicles designed for short, lightweight travel and usually powered by human or low-power electric motors).
We address the following questions:
How do PMDs make transport choices based on perceived accessibility?
What physical, social, and personal factors shape these perceptions, and how do they influence multimodal travel?
We use accessibility theory within disability studies and theory on perceived accessibility to explore PMDs’ mobility decision-making in multimodal contexts. We used participant observation, online survey, and narrative interviews with 35 PMDs in Quebec City, using wheelchairs, canes, walkers, and mobility scooters.
Even public transport that meets accessibility standards may not be perceived as accessible by users (Lättman et al. 2016). Social and personal factors are key (An et al. 2022). First, access to barrier-free multimodal transport is unequal, exacerbating social disparities. Second, awareness of accessible mobility options varies. Third, even when accessible options exist, PMDs may not use them due to limited bus seating, anxiety about fixed-route transit, a preference for micromobility, or first- and last-mile challenges. The “first and last mile” refers to the initial and final segments of a transit trip, during which riders must travel to and from public transport stops in a safe and accessible manner (Levine 2024). Enhancing transport accessibility improves autonomy and quality of life for PMDs and older adults (Asplund et al. 2012; Best et al. 2022; Boucher et al. 2019; Kett et al. 2020), benefiting society as a whole (Noreau et al. 2020).
2. Theoretical Framework
2.1. Transports accessibility inequalities
Social exclusion and discrimination limit inclusive cities and equal urban access (United Nations 2009). Mobility inequalities affect vulnerable groups like PMDs (Lucas et al. 2019). To promote mobility justice, barrier-free measures are being adopted, guided by the UN CRPD (Articles 9 and 20), ratified in Canada and Quebec in 2010. Canada’s Accessible Canada Act targets a barrier-free society by 2040 (Government of Canada 2021, 8), focusing on transport and requiring disability involvement in policy-making. However, the effectiveness of these policies depends on understanding accessibility perceptions and mobility barriers in travel choices.
Barrier-free policies and universal accessibility may not equally benefit vulnerable groups like PMDs if accessible routes are not perceived as usable. Focusing only on objective accessibility and infrastructure limits impact unless subjective factors, such as the appeal of multimodal travel, social perceptions, and values of autonomy, are considered. Mobility is a fundamental right (U.S. Access Board 2023) essential for social inclusion and urban wellbeing. Thus, accessible transport and public spaces are key to building inclusive cities and strong social ties (The Conference Board of Canada 2018).
2.2. Disability production process: An interactionist systemic perspective
Mobility disability refers to individuals facing disabling mobility situations using aids like wheelchairs, canes, or scooters, which may limit social participation and mobility justice (Cook and Butz 2018). Mobility justice explores how power and inequality shape movement and access (Sheller 2018). Our approach follows the HDM-DCP model, where social participation depends on interactions between personal traits and physical/social environments (Fougeyrollas et al. 2015). Cities can be disabling when they fail to meet diverse needs, causing exclusion (Prince 2016). Disability results from environmental barriers and personal factors affecting lifestyle and social roles and influencing mobility experiences (Boucher 2003; Fougeyrollas et al. 2019; Mwaka et al. 2024).
Our research defines access using the HDM-DCP approach, emphasizing ‘usability’—the interaction of personal, environmental factors, and lifestyle habits. Usability is the subjective evaluation of how well a service matches a person’s abilities and needs. In travel behavior, this aligns with perceived accessibility, linked to self-reports (Curl 2013). By combining these concepts, our study better explains factors shaping multimodal transport choices among PMDs, aiding the creation of more inclusive transport systems.
2.3. Perceived accessibility on transports
The perceived accessibility approach reflects how individuals evaluate their living conditions and the ease of conducting daily activities with specific travel modes, such as public transportation (Curl 2018; Lättman et al. 2018; Márquez et al. 2019; Pot et al. 2021). These assessments are subjective, influenced by contextual, climatic, cultural, and geographical factors, and cannot be measured objectively; therefore, including subjective experiences can enhance the realism of accessibility indicators, as perceptions of options are as important as the options themselves (Wee 2016). The complexity of perceived accessibility suggests also accounting for personal factors, such as capabilities and limitations arising from environmental barriers (Sundling et al. 2013). The concept has emerged to measure and evaluate the potential use of opportunities for accessing services and activities, linking closely to perceptions of safety and service quality in transportation (Friman et al. 2020). Individuals’ experiences of accessibility consider availability, affordability, and acceptability, extending beyond conventional metrics like distance and cost (Curl 2018). However, we do not know how these factors relate to each other to produce transport choices in a barrier-free context of multimodal availability.
Pot et al. (2021) present a model of perceived accessibility shaped by land use, transport, and temporal factors, influencing spatial decisions through personal perceptions and knowledge. Travel supports lifestyles rather than being an end in itself (Jamei et al. 2022), making perceived accessibility key for inclusive multimodal mobility. Traditional objective measures, like travel time, overlook experiences of groups such as PMDs. Studying perceived accessibility reveals what drives mobility and its variation. Although some studies address perceived accessibility for people with mobility disabilities (Friman and Olsson 2023; Gamache et al. 2020; Grisé et al. 2019; Maisel et al. 2021; Márquez et al. 2019; Sze and Christensen 2017; Wretstrand et al. 2004), empirical research on their multimodal transport choices remains limited.
2.4. Multimodal transport choices
Recent literature has advanced understanding of subjective accessibility and travel choices (De Vos et al. 2022), especially for public transport (Friman et al. 2020). However, excluding private modes like cars and micromobility limits knowledge of multimodal travel behavior. Beyond traditional factors such as wait times and costs, transport choices depend on the availability and perceived complementarity of options (Márquez et al. 2019). No studies yet explore how perceived accessibility affects multimodal choices—including public, private, and micromobility—among PMDs. Existing research mostly focuses on public transport accessibility for PMDs (Kwon and Akar 2022; Maisel et al. 2021; Márquez et al. 2019), leaving multimodal contexts underexamined.
3. Case Study (Context)
3.1. Transportation trends in Quebec City
Quebec City, the capital of Quebec province, had a population of 549,459 in July 2021, with a metropolitan area of 839,311 (Statistics Canada 2021). It is the province’s second-largest city after Montreal. The city has a humid continental climate, with warm summers and snowy winters. Reflecting the North American trend of car dependence, Quebec residents predominantly use cars over public transport. The 2017 Origin Destination Survey (EOD) (Ministère des Transports du Québec et al. 2019), which covers 41 cities and municipalities divided into four major regions, including the Quebec Agglomeration, shows that from 2011 to 2017, cars increased by 20% (from 444,600 to 534,500), while public transit use declined by 4.2% among Quebec Agglomeration residents. In 2017, public transit accounted for only 7% of trips, ranking behind automobile drivers (63.9%), passengers (14.6%), and walking (9.2%). Two-thirds of daily car trips were made by Quebec Agglomeration residents.
3.2. Availability of barrier-free transports in Quebec City
The Réseau de transport de la Capitale (RTC) manages public transit in Quebec City, including paratransit (STAC) for those with significant mobility impairments. Eligibility requires a permanent inability to use fixed-route transit (Ministère des Transports du Québec 1998). Since May 2023, low-income households receive a 33% discount on the $3.75 fare and monthly passes. RTC plans to make 1,000 bus stops accessible by 2028 (RTC Media 2022); currently, 430 of 4,435 stops and 13 of 170 routes are accessible, with 77.9% of vehicles wheelchair-friendly (RTC 2022). Flexibus, an on-demand service, connects peripheral areas to the RTC network. Despite these efforts, fixed-route transit remains largely inaccessible.
4. Methodology
Before describing the methods, we briefly restate the focus of the study: how perceived accessibility influences the transport choices of PMDs in a multimodal context (fixed-route bus, paratransit, car, micromobility). We address two main questions:
How do PMDs make transport choices based on perceived accessibility?
What physical, social, and personal factors shape these perceptions and influence multimodal travel?
4.1. Field delimitation
Our sample includes PMDs from a Quebec-based grassroots organization with over 40 years of advocacy and 229 members, working on issues such as poverty, home accessibility, paratransit, transit access, employment, and social participation. While local data is lacking, 7.4% of Quebecers over 15 have a ‘mobility disability’ (Statistics Canada 2022), defined by physical limitations, an ‘objective’ standard our study on perceived accessibility seeks to challenge. Our participants, like many in this group, often face higher rates of living alone, lower education, and unemployment, trends likely mirrored in Quebec City.
4.2. Participant eligibility criteria and recruitment process
Participants were selected based on broad, non-categorical criteria, focusing on disability-related mobility experiences rather than diagnoses or technologies used. Minors, individuals under legal guardianship, and those using alternative communication methods were excluded due to limited capacity for ethical communication. Anchored in PMD living in Quebec City, the study followed a relational ethnographic approach (Desmond 2014, 548), prioritizing fields and processes over fixed groups or places. Recruitment was done through a partner organization, which provided contact information; initial outreach was followed by face-to-face narrative interviews with eight participants. Methodological limitations are discussed in section 5.7.
4.3. Data collecting
In 2023, we conducted ethnographic research in Quebec City, combining 165 hours of participant observation, an online survey, and narrative interviews (NIs) (Jovchelovitch and Bauer 2000). The NIs, grounded in participants’ experiences and values (Feixa et al. 2020), clarified mobility strategies and perceived accessibility. Observation focused on how mobility aids (e.g., wheelchairs, scooters) interact with transport infrastructure. Fieldwork included transit hubs, community events, rehab clinics, and activities organized by a local accessibility advocacy group.
The study was conducted in two phases, with ongoing participant observation:
Online Survey: Designed for this research, the 89-question survey gathered data on sociodemographics, transport use, and self-perceived autonomy. It focused on mobility experiences related to transportation, territory, and social participation. The survey covered seven themes: (1) personal journey; (2) health; (3) activities of interest; (4) transportation; (5) social relationships; (6) disability; and (7) future outlook. Sent to 125 members of a partner organization, it received 35 responses (~30% participation).
Narrative Interviews (NI): Based on the idea that storytelling shapes identity (Grard 2017), each interview began with, ‘What have been the greatest challenges in your life, and how has your entourage influenced your path?’ This open format let participants guide the conversation. The first author conducted eight 1.5-hour interviews with survey respondents (ages 20–85) with permanent mobility disabilities. Held in public spaces, the interviews explored transport use, mobility aids, social ties, and environmental barriers. Participants were selected for diversity in age, gender, mobility levels, and transport modes. Each received CAD 50.
Data from surveys, interviews, and observations were analyzed in NVivo. The study was approved by the CIUSSS de la Capitale-Nationale ethics board (protocol 2023-2811), with informed consent from participants. To ensure transferability (Lincoln and Guba 1985), we included diverse profiles and reached data saturation. While not capturing the full complexity of transport choices, the study highlights shared experiences of mobility disability. Our mixed-methods approach triangulated qualitative and quantitative data, combining survey trends with in-depth insights from interviews and observations.
4.4. Participant’s sociodemographic
4.4.1. Survey participants (n = 35)
Table 1 shows the socio-demographic distribution of the sample. The last available census data in the province of Quebec showed that the average distribution of people with ‘mobility-related disabilities’ (e.g., the ability to go up and down stairs) was 44% and 35% among males and females, respectively (Cloutier-Villeneuve and Institut de la statistique du Québec 2021). The distribution of male and female PMDs in the sample is close to the census distribution, suggesting that our sample is nearly representative in terms of gender.
Table 1
Socio-demographic and mobility patterns of survey participants (n = 35).
| CATEGORY | SUBCATEGORY | PARTICIPANTS (%) |
|---|---|---|
| Gender 1 | Female | 20 (57.1%) |
| Male | 15 (42.9%) | |
| Age Range | 20–30 | 1 (2.9%) |
| 31–41 | 5 (14.3%) | |
| 42–52 | 7 (20.0%) | |
| 53–63 | 11 (31.4%) | |
| 64–73 | 9 (25.7%) | |
| 74–85 | 2 (5.7%) | |
| Mobility Aids Used (Multiple selections possible) | Manual Wheelchair | 16 (45.7%) |
| Powered Wheelchair | 14 (40.0%) | |
| Four-wheeled scooter | 5 (14.3%) | |
| Cane | 4 (11.4%) | |
| Walker | 3 (8.6%) | |
| White Cane | 1 (2.9%) | |
| Orthotic/Canadian Crutch, Vocal/Braille Software, Cane, JACO Robotic Arm | 1 each (2.9%) | |
| Principal Occupation | Retired | 15 (42.9%) |
| Part-time Worker | 6 (17.1%) | |
| Full-time Worker | 6 (17.1%) | |
| Volunteer/Humanitarian Work | 5 (14.3%) | |
| Homemaker | 1 (2.9%) | |
| Independent Worker | 1 (2.9%) | |
| Student | 1 (2.9%) | |
| Unemployed | 0 (0%) | |
| Level of Self-perceived Autonomy 2 | Very Autonomous | 10 (28.6%) |
| Fairly Autonomous | 19 (54.3%) | |
| Moderately Autonomous | 4 (11.4%) | |
| Slightly Autonomous | 2 (5.7%) |
[i] 1 Participants responded to: do you identify yourself as female, male, non-binary, or other?
2 Participants responded to: How would you assess your level of autonomy in daily life? They had to choose one of the four possible responses corresponding to a high to low level of self-perception: Very autonomous, Fairly autonomous, Moderately autonomous, Slightly autonomous.
The data provides a detailed profile of participants, highlighting a predominance of retirees and a higher proportion of females. The age distribution shows a concentration in the 53–73 age range. Mobility aid use is varied, with manual and powered wheelchairs being the most common, and canes also significantly used. The level of autonomy is generally high, with a majority considering themselves fairly autonomous.
4.4.2. Interview participants (n = 8)
Table 2 details interview participants’ sociodemographic data. The gender distribution of the interviewed participants (62.5% female, 37.5% male) closely matches the overall survey sample (57.1% female, 42.9% male), making the subgroup representative in terms of gender.
Table 2
Participants interviewed profiles (n = 8).
| PARTICIPANT | GENDER 1 | AGE RANGE | OCCUPATION | MOBILITY AID(S) |
|---|---|---|---|---|
| P1 | Female | 31–41 | Full-time Worker | Manual Wheelchair |
| P2 | Female | 31–41 | Retired | Cane, Walker |
| P3 | Male | 42–52 | Full-time Worker | Manual Wheelchair, Powered Wheelchair |
| P4 | Female | 53–63 | Retired | Manual Wheelchair, Four-wheel scooter, Orthotic/Canadian Crutch |
| P5 | Male | 64–73 | Retired | Manual Wheelchair, Four-wheel scooter, Cane |
| P6 | Female | 64–73 | Retired | Manual Wheelchair |
| P7 | Male | 53–63 | Retired | Manual Wheelchair |
| P8 | Female | 53–63 | Full-time Worker | Powered Wheelchair |
[i] 1 Participants responded to: do you identify yourself as female, male, non-binary, or other?
4.5. Data analysis
We used NVivo to code and analyze all data (surveys, interviews, observations), guided by Pot et al.’s (2021) perceived accessibility model. We created four main nodes: (1) Land-use (Lifestyle), (2) Transport (Mobility Resources), (3) Temporal (Mobility Behavior), and (4) Life Course Events, capturing changes in perceptions of disability over time. Using concept-driven coding (Charmaz 2014), categories and themes were refined with team review. A second coding cycle identified emergent categories: Mobility Values, Multimodal Choice, and Life Course Events. Through retroduction, we aligned these with our conceptual model, showing how land use, transport availability, and life habits shape perceived accessibility and multimodal transport choices (Farrington 2007). Figure 1 outlines the full coding process.
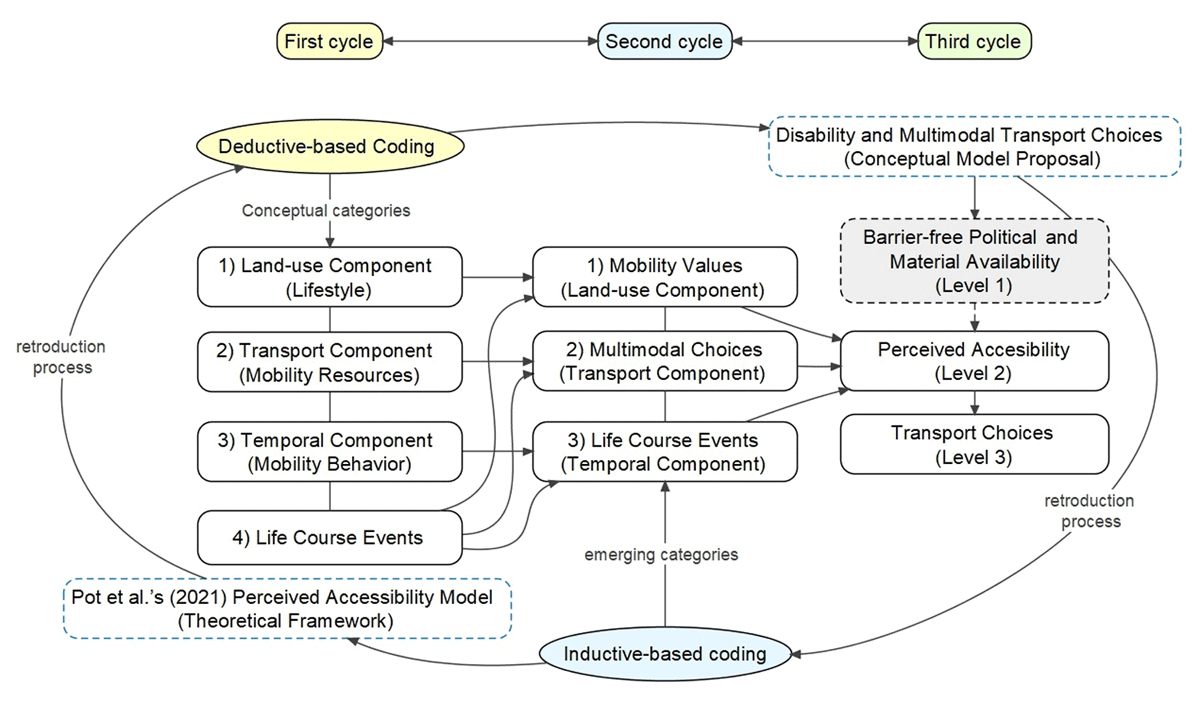
Figure 1
Analytical coding process in our research.
Our research examines determinants of perceived accessibility and transport choices, rather than political or material availability alone. While objective accessibility influences multimodal transport use, availability and perception both shape PMDs’ travel decisions. The three analytical levels reflect the Disability Production Process theory: environmental factors relate to political and material availability, while personal factors and life habits connect to perceived accessibility and transport choices. This interactionist approach views mobility as a subjective experience shaped by material and social conditions.
5. Results and Discussion
This study explores how perceived accessibility influences multimodal transport choices of persons with mobility disabilities (PMDs) in Quebec City. Although barrier-free transport exists, participants often avoid certain modes due to uncertainty, limited information, and potential disabling situations. Mobility habits reflect lifestyle, culture, and climate, with some preferring cars for autonomy and others using buses, paratransit, or micromobility. Social networks, safety, comfort, and transport performance also affect choices, consistent with prior research (Ababio-Donkor et al. 2020). This section analyzes participants’ mobility patterns, transport preferences, and perceived accessibility challenges, including first- and last-mile issues, and discusses needed improvements and future research directions.
5.1. Participants’ mobility patterns
5.1.1. Transportation modes usage and preferences
Paratransit is the most used transport mode among participants (Table 3), reflecting its key role in PMDs’ social inclusion (Murray 2020; Velho et al. 2016; Aarhaug and Elvebakk 2015). However, many never use paratransit. Private cars show polarized use, with one-third never using them. Nearly half avoid Individual Powered Vehicles (IEVs) like mobility scooters. Fixed-route buses and adapted bicycles are the least used, indicating barriers and low acceptance. Studies in different geographies have reported that the majority of PMDs use buses (Bezyak et al. 2017), or that paratransit comes in second place (Deka 2014), or even that taxis are the most popular mode (Márquez et al. 2019). Such variability indicates the impact that the environment has on PMDs’ life experiences (Fougeyrollas, Fiset, et al. 2019).
Table 3
Participants’ transportation mode usage and preferences (n = 35).
| TRANSPORTATION MODE | ACTUAL USE: PARTICIPANTS (%) | INTENTION TO USE: PARTICIPANTS (%) | DIFFERENCE | FAMILY AND FRIENDS USE: PARTICIPANTS (%) | FREQUENCY OF USE: AT LEAST TWICE A WEEK: PARTICIPANTS (%) |
|---|---|---|---|---|---|
| Private Vehicles | 11 (31.4%) | 19 (54.3%) | +72.7% | 25 (71.4%) | – |
| Paratransit | 16 (45.7%) | 7 (20.0%) | –56.3% | 7 (20%) | 15 (42.8%) |
| Individual Powered Vehicles (IEVs) | 11 (31.4%) | 2 (5.7%) | –81.8% | – | – |
| Fixed-route Public Buses | 5 (14.3%) | 5 (14.3%) | 0% | 2 (5.7%) | 7 (20.0%) |
| Adapted Bicycles | 4 (11.4%) | 2 (5.7%) | –50.0% | 1 (2.9%) | – |
The data highlights a preference for private vehicles among participants, which increases significantly when considering intended use versus actual use. More than half of the participants either own a car or live with someone who does (51.4%). Most do not have a driver’s license (60%) and do not intend to obtain one (74.3%). Social circles favor private vehicles, influencing preferences and perceptions of accessibility and convenience in Quebec City, an automobile-oriented city. Using a private vehicle is a lifestyle choice driven by residence, work, and a desire for comfort, safety, and freedom. P1 drives an SUV with hand controls: ‘That’s the way I wanted it’. P5 values the independence of their truck and four-wheeler. P6 appreciates the ‘freedom’ her car provides. P7 and their wife have adapted cars. P3 prefers traveling in their wheelchair: ‘I prefer to travel in my wheelchair all the time. Then I feel more free’. Some use the bus or paratransit when parking is unavailable: ‘I’ve rarely taken paratransit, except during the Summer Festival because parking downtown is complicated and expensive’ (P7). Studies have found that older adults with mobility disabilities feel more autonomous, flexible, and independent when they can drive (Siren and Hakamies-Blomqvist 2004), and that the elderly in developed countries are increasingly car-dependent, using fewer alternative transportation modes (Rosenbloom 2009).
Fixed-route buses maintain a consistent level of use, reflecting a stable but less preferred option. The discrepancy between intended and actual use of individual powered vehicles and adapted bicycles suggests barriers to their adoption. This finding highlights the need to enhance the attractiveness and usability of bike paths and sidewalks to promote micromobility, as other studies show that improving walkability positively impacts urban mobility for PMDs (Kwon and Akar 2022).
5.1.2. Reasons for travel on fixed-route bus and paratransit
Work and medical appointments are the most common travel purposes for both fixed-route buses and paratransit (Table 4).
Table 4
Main and least cited reasons for using public transport (n = 35).
| MODE OF TRANSPORT | MAIN REASONS FOR TRAVEL/PARTICIPANTS (%) | LEAST FREQUENT REASONS FOR TRAVEL/PARTICIPANTS (%) |
|---|---|---|
| Fixed-route Bus | Work, Medical Appointments/ 13 in each category (37.1%) | Work, Tourism and Leisure/11 in each category (31.4%) |
| Paratransit | Work, Medical Appointments/14 in each category (40.0%) | Work, Tourism and Leisure, Medical Appointments/ 13 in each category (37.1%) |
However, tourism/leisure is among the least cited reasons for bus use, while medical appointments appear less frequently in paratransit trips. This underscores public transport’s essential role in facilitating daily activities but does not establish a causal link between travel motives and mode choices. Participants operate within a multimodal context, selecting transport modes based on preference rather than trip purpose (An et al. 2022; He et al. 2024). Convenience, including flexibility, comfort, and efficiency, significantly influences choices. Paratransit’s door-to-door service is preferred for medical appointments, while fixed-route buses suit work commutes due to frequent schedules. This aligns with findings that PMDs prioritize safety, arrival time, comfort, and financial considerations when selecting transport (Mogaji et al. 2023). Their choices balance spontaneity and reliability, flexibility and safety (Mansilla et al. 2024).
5.2. Perceived accessibility in multimodal transport
5.2.1. Factors influencing perceived accessibility of fixed-route bus
Participants’ choice to use fixed-route buses is influenced by physical and social obstacles, as well as motivating factors related to comfort and accessibility (Table 5). While improving infrastructure and social interactions with drivers could increase usage, discrimination and existing physical barriers remain significant concerns for PMDs in multimodal transport. Social barriers often outweigh physical ones, as illustrated by P3: ‘Paratransit picks me up at the door, but rush hour buses are packed, making it hard to get in and take a seat’. Similarly, P2 fears not finding a seat: ‘I don’t know how long I’ll have to stand or walk’. Winter conditions further limit accessibility: ‘In Quebec City, in winter, taking the sidewalk to the bus stop is impossible’ (P8), reinforcing findings that winter reduces transport access for PMDs (Ripat et al. 2015).
Table 5
Perceived accessibility of fixed-route buses: obstacles, motivating factors, improvements (n = 35).
| DIMENSION | CATEGORY | FACTOR/DETAIL | PARTICIPANTS (%) |
|---|---|---|---|
| Obstacles for Choosing Fixed-Route Bus | - Social Factors | - Crowded buses and potential seat negotiation discomfort | 15 (42.8%) |
| - Crowded bus stops | 11 (31.4%) | ||
| - First and Last Mile Environment | - Incline of the street leading to the bus stop | 12 (34.2%) | |
| - Physical Infrastructure | - Lack of information at bus stops | 10 (28.6%) | |
| - Steep ramp incline for bus access | 8 (22.8%) | ||
| - Narrow boarding area for wheelchairs | 7 (20.0%) | ||
| - Bus stops without shelter | 6 (17.1%) | ||
| Motivations for Choosing Fixed-Route Bus | - Comfort and Social Interactions | - Spontaneity in trip planning | 27 (77.1%) |
| - Increased wheelchair spaces | 15 (42.9%) | ||
| - More tolerant drivers who wait for passengers | 12 (34.3%) | ||
| - First and Last Mile Environment | - Bus routes close to homes | 12 (34.3%) | |
| - Flexibus MaaS service | 8 (22.9%) | ||
| - Accessible bus stops from homes | 7 (20.0%) | ||
| - Price of Tickets | - Affordable ticket prices | 30 (85.7%) | |
| Factors to Improve the Fixed-Route Bus Travel | - Physical Infrastructure Improvements | - More accessible bus stops for wheelchairs | 29 (82.9%) |
| - Reducing travel time (somewhat urgent) | 21 (60.0%) | ||
| - Reducing travel time (very urgent) | 14 (40.0%) | ||
| - Social Factors Improvements | - Kind drivers who wait for passengers | 29 (82.8%) | |
| - Perception of Discrimination | - Never experienced discrimination | 21 (60.0%) | |
| - Rarely experienced discrimination | 9 (25.7%) | ||
| - Sometimes experienced discrimination | 5 (14.3%) |
Micromobility devices also affect accessibility: ‘I don’t take the bus because a four-wheeler scooter doesn’t fit’ (P4), while powered wheelchair users struggle with multimodal combinations: ‘A powered wheelchair and a car don’t work together’ (P7). Despite bus accessibility improvements, some participants remain reluctant: ‘Buses have been accessible for years in Quebec City, but I never took one’ (P7). Confusion over the system further discourages use: ‘I don’t understand how it works. I’ve looked at it, but I don’t understand’ (P8). Conversely, frequent routes and nearby stops motivate use: ‘Buses run every 10 minutes, it’s easy to take it’ (P3). Well-maintained sidewalks and scenic paths encourage micromobility: ‘During the summer season, the bike paths are fantastic! You forget the pain when you see beautiful landscapes’ (P5). However, concerns about stop accessibility persist: ‘There’s nothing worse than taking the bus at an accessible point, and then the point where you want to stop is not accessible’ (P7). Safety at bus stops also remains an issue: ‘I could go down that slope to catch the bus, but there’s no covered bus stop’ (P6). This sense of safety related to the need for covered bus stops reflects the importance of protection against environmental uncertainties such as rain or snowstorms (Mansilla et al. 2024). The design of bus stops has been identified as a key factor in barrier-free mobility (D’Souza et al. 2017). However, perceptions of safety vary significantly between individuals (Chaves et al. 2007), which makes studies on perceived accessibility crucial for understanding diverse mobility experiences. Our findings align with research showing that public transport quality, safety, and frequency influence perceived accessibility (Lättman et al. 2016).
5.2.2. Factors influencing perceived accessibility of paratransit
Spontaneity in paratransit booking is a significant concern, as more than half of the participants prefer not to reserve a day in advance (Table 6). While a minority are content with the current system, a notable portion does not use paratransit at all, highlighting the need for flexibility and improved service quality to better meet user needs and potentially be more attractive—recent research reports similar perceptions about lack of spontaneity among paratransit users in Switzerland (Egger et al. 2022).
Table 6
Factors for improving paratransit travel experience (n = 35).
| DIMENSION | FACTOR | PARTICIPANTS (%) |
|---|---|---|
| Service Quality and Comfort | - Increasing the number of drivers | 26 (74.3%) |
| - Reducing the advance notice time for reservations | 23 (65.7%) | |
| Spontaneity in Paratransit Trips | - Prefer spontaneous trips without a day in advance | 19 (54.3%) |
| - Not bothered by advance reservation | 6 (17.1%) | |
| - Do not use paratransit | 10 (28.6%) |
Travel time with paratransit can be longer due to frequent stops: ‘An hour and a half’s transport after work is not ideal’ (P4). Paratransit also requires early pickups: ‘If my wife has a 9 am appointment, sometimes they come at 7:30 am. It’s much too early’ (P4). Participants prefer the spontaneity of fixed-route buses: ‘The fixed-route bus is for when I suddenly want to go somewhere’ (P2). However, fixed schedules make paratransit preferable for work: ‘I know which days I’m going to work, so I book them the day before’ (P3). During winter, paratransit addresses first- and last-mile problems by offering reliable door-to-door service: ‘In winter, I can’t get to the office in my powered wheelchair. So, I prefer paratransit because it picks me up at my door’ (P3). As pointed out by other studies (Ripat et al. 2015), winter is a major obstacle to PMDs’ social participation. Environmental barriers in the first and last mile often lead participants to prefer paratransit over regular buses. Some change modes depending on weather conditions, while others reduce their mobility entirely. A Canadian study similarly found that wheelchair users limit community participation in winter due to multiple barriers along the first and last mile (Ripat et al. 2015).
5.2.3. First- and last-mile environment
Most participants rate Quebec City’s accessibility as average, with notable location differences (Table 7). Improving physical infrastructure in public spaces and transport is key to encouraging outings. While participants want to visit accessible places like stores and parks, better overall accessibility is needed. Mobility habits influence travel more than the perceived accessibility of new places, aligning with research showing habits guide behavior over deliberate decisions (De Vos et al. 2022, 214).
Table 7
Perceptions and improvements in the accessibility for collective infrastructure in Quebec City (n = 35).
| MEASURE | PERCEPTION | PARTICIPANTS (%) |
|---|---|---|
| Overall Accessibility in Quebec City | - Average accessibility (some places very accessible, others not at all) | 25 (71.4%) |
| - Lack of accessibility almost everywhere | 9 (25.7%) | |
| - Neighborhood is accessible for getting around | 26 (74.3%) | |
| Encouragement to Leave Home (Top 3 Improvements) | - Stores | 20 (57.1%) |
| - Restaurant terraces | 18 (54.1%) | |
| - Accessible sidewalks for wheelchairs, Individual Powered Vehicles (IEVs). | 16 (45.7%) | |
| Perceived Accessibility of Transportation | - Improving the paratransit service | 15 (42.9%) |
| - Making buses more accessible | 11 (31.4%) | |
| Interest in Exploring New Accessible Places | - Thought about exploring new accessible places in the city in the last six months. | 21 (60.0%) |
To create an inclusive city, participants prioritize universal accessibility in public spaces and transportation, inclusive laws, and anti-discrimination penalties (Table 8). Addressing risky mobility situations like inaccessible furniture, paratransit malfunctions, and sidewalk falls is also crucial for a safer, more inclusive environment.
Table 8
Urgent measures and risky mobility situations for creating an inclusive city (n = 35).
| MEASURE | PERCEPTION | PARTICIPANTS (%) |
|---|---|---|
| Urgent Measures for an Inclusive City | - Improving universal accessibility in public places | 33 (94.3%) |
| - Improving transportation accessibility | 28 (80.0%) | |
| - Creating inclusion laws for minority groups | 29 (82.9%) | |
| - Enforcing severe penalties for all types of discrimination | 26 (74.3%) | |
| Risky Mobility Situations to Avoid | - Non-adapted or inaccessible public/private furniture | 24 (68.6%) |
| - Paratransit malfunctions | 18 (51.4%) | |
| - Falling on a sidewalk | 12 (34.3%) |
5.3. Transportation choices in multimodal context (subset sample n = 8)
Table 9 summarizes the various factors affecting transportation mode choice among the interview participants, categorized by environmental, service quality, and personal preference elements. Each factor is noted for how it impacts the choice between bus, car, paratransit, or micromobility, highlighting the complexity and interplay of multiple aspects influencing mobility decisions.
Table 9
Factors influencing multimodal transport choices (n = 8).
| CATEGORY | SUBCATEGORY | FACTOR DESCRIPTION | IMPACT ON TRANSPORTATION CHOICES * |
|---|---|---|---|
| First and Last Mile Environment | Sidewalks | Sidewalks falling down | Prefers paratransit or car |
| Sidewalk condition uncertain | Prefers paratransit | ||
| Bike Paths | Fantastic in summer | Prefers micromobility | |
| Scenery | Beautiful landscapes | Prefers micromobility | |
| Proximity | Close to residence | Prefers micromobility | |
| Bus Stop | Infrastructure | No covered stop | Prefers paratransit or car |
| Accessibility | Desired stop not accessible | Prefers car | |
| Proximity | Bus stop close to residence | Prefers bus | |
| Weather | Conditions | Snow on sidewalks or strong wind | Prefers paratransit or car |
| Adaptation | Must adapt to winter | Prefers paratransit | |
| Good Weather | Facilitates micromobility | Prefers micromobility | |
| Lacking Car Parking | Parking Availability | No available parking | Prefers paratransit or bus |
| Mobility Aid Compatibility | Assistive Equipment | Four-wheeler scooter doesn’t fit in bus | Prefers paratransit |
| Powered wheelchair doesn’t fit in car | Prefers paratransit | ||
| FreeWheel Usage | Difficult to use FreeWheel | Prefers car | |
| Physical Accessibility | Bus Accessibility | Not all routes are accessible | Prefers paratransit or car |
| Information Clarity | Public Transit Understanding | Unclear how the public transit system works | Prefers paratransit |
| Service Quality | Transfer | Quality of transfer service | Prefers paratransit |
| Service Safety and Reliability | Door-to-Door Service | Picks up at door | Prefers paratransit |
| Fear of Injury | Stability | Fear of falling | Prefers paratransit |
| Vehicle Movement | Wheelchair moves during sharp turns or acceleration | Prefers paratransit or car | |
| Temporal Constraints | Frequency | Frequent bus service | Prefers bus |
| Post-Work Transport Duration | Long transport time after work | Prefers car | |
| Early Departure | Departure too early | Prefers car | |
| Social Factors in Travel | Crowding | Difficulty entering or exiting, crowded buses | Prefers paratransit or car |
| Seat Availability | Uncertainty to find a free seat | Prefers paratransit | |
| Seat Conflicts | Conflicts over the single adapted seat | Prefers paratransit or car | |
| Social Activity Flexibility | Paratransit Flexibility | Lack of flexibility in paratransit | Prefers bus |
| Spontaneous Needs | Desire for spontaneity | Prefers bus | |
| Sudden Urges | Ability to accommodate sudden needs | Prefers bus | |
| Booking Ahead for Work | Books the day before for work | Prefers paratransit | |
| Mobility and Aging | Manual Wheelchair Constraints | Shoulder problems limit manual wheelchair use | Prefers paratransit |
| Age-Related Mobility Decline | Decline in physical ability over time | Prefers paratransit | |
| Car Entry Difficulty | Unable to get into the car independently | Prefers paratransit | |
| Freedom and Independence | Car Preference | Personal preference for vehicle type and independence | Prefers car |
| Self-Sufficiency | Valuing self-sufficiency and independence | Prefers car | |
| Powered Wheelchair Freedom | Enhanced freedom using powered wheelchair | Prefers micromobility |
[i] * Transport choices reflect the narratives of accessibility of the interviewed participants.
Findings reveal that physical barriers like poor sidewalks and uncovered bus stops often discourage fixed-route bus use, favoring paratransit or cars. Proximity to stops and favorable weather encourage micromobility use. Paratransit’s door-to-door service appeals especially to users with mobility aids unsuitable for buses or cars. Social factors, such as crowded buses and seating uncertainty, also push preferences toward paratransit or personal vehicles. Independence challenges highlight the need for barrier-free travel paths adaptable to varying abilities. Participants emphasize autonomy, flexibility, and reliability in transport choices, though uncertainty from limited information and possible disabling situations remains common. Studies indicate lifestyles and personality traits influence travel behavior and mode satisfaction (Acker et al. 2011; De Vos et al. 2022).
5.4. Limitations and Future Research
This study provides theoretical tools for analyzing travel behavior in disability and inclusive mobility through an ethnographic case study in Quebec City. Despite limitations like a small sample and specific context, it offers valuable insights. Future research should examine how life-course disabling events, aging, infrastructure, social factors, personal values, and technology affect perceived accessibility and mobility choices. Methodological limitations include excluding participants using alternative communication devices due to a lack of resources, potentially missing important perspectives. The online survey may have excluded those without internet access or with digital access difficulties, while in-person interviews might have limited participation from people with mobility barriers to travel. Additionally, different participant profiles, such as retirees versus employed individuals, reveal varied mobility needs and challenges.
6. Practical Implications
For policymakers, urban planners, and transport providers, this study highlights the need to address both the physical availability and users’ perceptions of transport options, especially for people with mobility disabilities. Policies should tackle barriers linked to availability, land use, and timing. Inclusive infrastructure and seamless multimodal connectivity are essential, alongside reliable and accessible services. Understanding these factors can guide more effective strategies for truly accessible transport systems that enhance mobility for all.
7. Conclusion
This study examines how the physical availability of barrier-free multimodal transport influences perceived accessibility and transport choices among PMDs in Quebec City. Using both quantitative (online surveys) and qualitative (narrative interviews) methods, we identified physical, social, and personal factors affecting mobility decisions across fixed-route buses, paratransit, cars, and micromobility. While objective accessibility measures are essential, they do not fully determine transport mode choice; perceived accessibility plays a crucial intermediary role.
Our findings reveal that the mere availability of an accessible transport option does not guarantee its use. Social factors, such as crowded buses, passenger behavior, and trip purpose (e.g., work, medical appointments), significantly shape mobility decisions. Personal factors, including self-determination, influence transport choices. Additionally, physical barriers—poor sidewalk conditions, lack of sheltered bus stops, and adverse weather—affect perceived accessibility. While first- and last-mile issues lead many to rely on cars and paratransit, high walkability encourages micromobility. Dry weather favors micromobility and buses, whereas rain and snow push users toward paratransit and private vehicles.
Disabling mobility situations amplify perceived accessibility barriers in fixed-route buses, including concerns over mobility aid compatibility, unclear route information, unreliable transfers, and unsafe driving practices. Paratransit, while offering reliable door-to-door service, is perceived as restrictive due to its mandatory advance booking system and long trip durations. Participants value the spontaneity of fixed-route buses but also appreciate the reliability of paratransit. Improving usability in barrier-free transport requires addressing both objective conditions and perceptions of accessibility.
This study advances accessibility theory within disability studies, particularly regarding usability (Fougeyrollas et al. 2015), while also contributing to travel mode choice theory, emphasizing perceived behavioral control in mobility decisions (De Vos et al. 2022). By integrating these perspectives, we provide a holistic understanding of how physical, social, and subjective factors shape transport choices. Unlike traditional research focused solely on public transit or infrastructure, our approach highlights the complex interplay between personal, environmental, and social influences, offering valuable insights for inclusive urban mobility planning.
Competing interests
The authors have no competing interests to declare.
Author contributions
First author: J.C.M.; Coauthors: N.B. and F.R.; conceptualization: J.C.M.; methodology: J.C.M.; validation: N.B. and F.R.; formal analysis: J.C.M.; investigation: J.C.M.; resources: F.R.; data curation: J.C.M.; writing—original draft preparation: J.C.M.; review and editing: J.C.M., N.B. and F.R.; visualization: J.C.M.; supervision: J.C.M., N.B. and F.R.; project administration: J.C.M.; funding acquisition: F.R. All authors have read and agreed to the published version of the manuscript.