
Introduction
People with disabilities (PwDs) in Ethiopia have limited access to jobs and experience marginalization, distress, and practical challenges in both routine daily activities and in their participation in broader social roles and opportunities (Krupa et al. 2022). Students with disabilities also face significant barriers to full participation in vocational education programs, such as inadequate materials and facilities, lack of job trainers familiar with disability needs, and systematic exclusion (Malle, Pirttimaa and Saloviita 2015). The intersectionality of poverty and disability further compounds the challenges faced by individuals with disabilities, as infrastructural inaccessibility and social discrimination limit their access to livelihood opportunities (Mulubiran 2021).
According to the World Report on Disability, there are an estimated 15 million children, adults, and elderly PwDs in Ethiopia, comprising 17.6% of the population (ILO 2013; WHO and WB 2011). The vast majority of PwDs live in rural areas where access to basic services is limited. 95% of all PwDs are estimated to live in poverty (ILO 2013; UNICEF, MOLSA, & Development Pathways, 2019). The Ethiopian government has adopted and implemented several laws, policies, and standards regarding PwDs, including their right to productive and decent work. Three primary documents address this concern. First, the Constitution of the Federal Democratic Republic of Ethiopia, adopted in 1995, asserts the right of all persons to employment and education and sets out the State’s responsibility for the provision of necessary rehabilitation and support services for PwDs (Articles 41 and 90) (FDRE 1995). Second, the Right to Employees with Disabilities Proclamation (EHR 2008) nullifies any law, practice, custom, attitude, or other discriminatory situations that limit equal opportunities to employment for PwDs. It also requires employers to provide appropriate working and training conditions and provide reasonable accommodation, particularly when employing women with disabilities. ‘Reasonable accommodation’ in the workplace refers to anti-discriminatory measures that allow PwDs to exercise their right to work on an equal basis with others through necessary and appropriate modifications or adjustments to the environment, policies, or practices (UN 2023). Third, the Federal Civil Servants Proclamation (EHR 2007) provides for affirmative action through policies that require special preference in the recruitment, promotion, and deployment of qualified candidates with disabilities in government offices (ILO 2013).
However, there is a dearth of research on the adequacy of current policies, their practical impact on the job trajectories of PwDs, or exploration of any challenges, barriers, or enablers to their obtaining work. Indeed, there is a wide range of social and cultural perspectives on disability, and how these embedded belief systems and practices may impact job acquisition and maintenance. This research sought to fill this knowledge gap and contribute to a better understanding of the employment access of graduates from higher education institutions with physical, hearing, and visual impairment in Ethiopia. Thus, the study aimed at assessing the lived experience of PwDs in higher education and employment with regard to reasonable accommodations. We looked at the transition process—specifically how graduates of higher education institutes managed the job acquisition and onboarding process following completion of their education.
Theoretical Framework
This study is situated within critical disability studies, drawing on the social model of disability as a foundational perspective. The social model rejects deficit-oriented understandings of disability and instead locates exclusion in the material, institutional, and attitudinal barriers that structure participation (Barnes 1991; Oliver 1990). Within this framing, discriminatory hiring practices, inaccessible infrastructure, and rigid workplace policies are understood not as peripheral difficulties but as the very mechanisms that produce disability. By shifting the analytic lens from impairment (anomalies in psychological, physiological, or anatomical structure or function residing in the person) to the disabling environment (which includes the natural and built environment, available technologies, supports, attitudes, and system-level factors), the model emphasizes the political nature of disability and demands structural transformation rather than individualized intervention (WHO and WB 2011). Nevertheless, scholars have critiqued the social model for underemphasizing the embodied realities of impairment and for insufficiently engaging with the intersectional dynamics of class, gender, or geography (Nussbaum 2006; Shakespeare 2006), pointing to the need for more multidimensional approaches. Use of the social model helps improve our understanding of how context influences reported outcomes in the area of work and other social roles. As noted in the World Report on Disability, prevalence estimates related to disability and participation are difficult to compare due to differences in data-collection protocols and timing, while the relationship between health conditions and contextual factors creates vastly different circumstances through which to view outcomes (WHO and WB 2011).
The capabilities approach provides such a complement by offering a normative framework for evaluating well-being and justice in terms of the real freedom’s individuals possess (Nussbaum 2006; Sen 1999). In disability research, this perspective highlights the extent to which social factors enable or constrain the ability of PwDs to achieve valued functioning and to lead lives they value (Mitra 2006). Unlike resource-based measures, the capabilities approach accounts for variation in individual needs and contexts: two people with similar impairments may experience vastly different opportunities depending on the accessibility of their environment, the availability of assistive technologies, and the inclusivity of social and policy frameworks. By placing human flourishing front and center, it foregrounds both the removal of barriers and the proactive creation of enabling conditions for participation in work and society.
Taken together, these frameworks allow for a multilayered theorization of disability and employment. The social model directs attention to structural barriers that systematically disable individuals, while the capabilities approach interrogates the degree to which employment opportunities genuinely expand freedoms and enhance dignity. This combined lens is particularly salient in the Ethiopian context, where disability is shaped not only by inaccessible built environments and stigmatizing attitudes but also by poverty, weak institutional capacity, and uneven implementation of disability rights legislation. Our analysis, therefore, examines environmental, attitudinal, and policy-related obstacles to employment while recognizing the agency of individuals in negotiating transition into work. In doing so, the study situates its findings within wider academic debates about the intersection of disability, labor, and social justice, while also contributing to the growing scholarship on disability and development in the Global South.
Methods
Study design and study participants
This cross-sectional study used a survey to investigate the employment experiences and access to workplace accommodations among university graduates with disabilities in Ethiopia. Data were collected between February and July 2021. A multi-stage cluster sampling strategy was used to recruit participants from public sector offices across three regional states (Oromia, Amhara, and the Southern Nations, Nationalities, and Peoples’ Region [SNNPR]) and the capital city administration of Addis Ababa. Sampling began at the federal ministry level and proceeded to regional bureaus, zonal, and finally district (woreda) level offices.
To be eligible, participants had to: (a) be a graduate of a recognized university or college; (b) self-identify as having a visual, auditory, and/or locomotor impairment; and (c) be employed in the public sector at the time of the study. Individuals with cognitive or psychosocial disabilities were excluded due to the methodological challenges of ensuring valid consent and accurate data collection with the available resources, though we acknowledge this as a limitation. The selected impairment categories align with the most prevalent disability types in Ethiopia, representing an estimated 83.6% of the disabled population (JICA 2002). All workers who satisfied the eligibility criteria were included in the invitation to participate.
Sample size procedures and determination
The sample size was calculated using the formula by Cochran, Mosteller and Tukey (2006) for cross-sectional studies. The calculation assumed a 95% confidence level (Z = 1.96), a 5% margin of error (d = 0.05), a conservative prevalence (p) of 50% to maximize the sample, a design effect of 2 to account for the cluster sampling, and a 5% non-response rate. This yielded a minimum a priori required sample size estimate of 807 individuals.
Data collection tools and procedures
Data were collected using a semi-structured interviewer-administered questionnaire. The instrument captured information on socio-demographic characteristics, educational history and transition to employment, current employment status and experiences, need for and receipt of workplace accommodations, and perceptions of disability-related laws and policies. Perceptions were measured through six key questions rated on a five-point Likert scale (0 = ‘I don’t know’ to 5 = ‘strongly agree’). For analysis, these responses were dichotomized into ‘good’ and ‘poor’ perception categories using a standard demarcation threshold formula to facilitate interpretation.
The data collection process was designed to be accessible and inclusive. Interviews were conducted primarily in Amharic. For participants who were deaf or hard of hearing, qualified sign language interpreters were provided. The questionnaire was translated into Amharic and then back-translated into English to ensure conceptual accuracy and consistency. It was pre-tested in a non-sample district, and necessary adjustments were made prior to full implementation. Data collectors received a comprehensive two-day training that covered the study objectives, research ethics (with emphasis on disability-competent engagement), and detailed procedures for administering the questionnaire consistently and accurately.
Statistical analysis
Data were entered via KoboToolbox, cleaned, and analyzed using Stata 14. We used descriptive statistics—frequencies, percentages, means, and standard deviations—to summarize participants’ socio-demographics, education, employment, and perceptions. For inferential analysis, we conducted chi-square tests for categorical variables and either t-tests or one-way ANOVA for continuous variables, selecting tests based on variable distribution and group comparisons. We considered results statistically significant at p < 0.05. To simplify reporting and support interdisciplinary readership, perception items measured on the five-point Likert scale were dichotomized into ‘good’ and ‘poor’ using a demarcation threshold formula: the cut-off was calculated as (maximum possible score minus minimum possible score)/2, then added to the minimum possible score. This threshold distinctly separates two outcome categories and facilitates cross-disciplinary interpretation.
Ethical approval and consent to participate
Ethical approval for this study was obtained from the University of Gondar Institutional Review Board (O/V/P/RCS/05/354/2018) and the Queen’s University General Research Ethics Board (Certificate #REH-738-18). In addition, supportive letters were obtained from the Federation of Ethiopian Associations of Persons with Disabilities (FEAPD) and the respective regional administrative offices. The principle of voluntary participation was strictly upheld. Verbal informed consent was obtained from all participants prior to enrolment. The consent process ensured that participants were fully aware of their right to withdraw from the study at any point without consequence. To protect confidentiality, all participant-identifying information was removed and replaced with coded identifiers. All electronic data were stored on a password-protected secure server.
Results
Socio-demographic characteristics of the survey respondents
Participants were slightly more likely to have been raised in an urban area than in a rural region, and almost a fifth of the sample reported being raised in both rural and urban areas. The median age of participants was 33 years (standard deviation (SD) of 8.3 years), with ages ranging from 21 to 62. The largest percentage of participants were men, who represented close to 70% of the sample. Nearly 60% of participants were married, 41% lived with their spouse and children, and 18.2% lived alone. A smaller proportion of respondents (just under 40%) reported receiving personal assistance at home, and approximately 32% received government financial assistance (see Table 1).
Table 1
The socio-demographic characteristics of study participants.
| VARIABLES | FREQUENCY (n) | PERCENT (%) |
|---|---|---|
| Place where you grew up | ||
| Urban | 344 | 43.9 |
| Rural | 303 | 38.6 |
| Both rural and urban | 137 | 17.5 |
| Age/year | Median ± SD 33 ± 8.3 | |
| 21–28 years old | 204 | 26.0 |
| 28–33 years old | 214 | 27.3 |
| 33–40 years old | 193 | 24.6 |
| 40–62 years old | 173 | 22.1 |
| Gender | ||
| Male | 526 | 67.1 |
| Female | 258 | 32.9 |
| Current marital status | ||
| Married | 451 | 57.5 |
| Single | 305 | 38.9 |
| Others (separated, widowed, and divorced) | 28 | 3.6 |
| Living conditions | ||
| With spouse and/or children | 318 | 40.6 |
| With parents/family/relatives | 115 | 14.7 |
| Living with others in a shared room | 7 | 0.9 |
| Live alone | 143 | 18.2 |
| Question items | Yes n (%) | No n (%) |
| Presence of personal assistance at home | 305 (38.9) | 479 (61.1) |
| Did your assistant have any impairment/s? | 9 (1.1) | 296 (37.8) |
| Opportunity to receive government financial assistance | 254 (32.4) | 521 (66.5) |
Types and levels of disabilities
The greatest proportion (59.2%) of impairments was attributed to motor difficulty. Most respondents reported that they did not require mobility aids, with just 26% of those with a physical disability requiring the use of aids such as braces, prosthetic devices, and crutches. Visual impairments made up the next most prevalent group of participants, at 36.7%. Of these, total blindness accounted for the greatest proportion of study participants (26.9% of the total sample). A relatively small share of participants (4.1%) reported a hearing impairment, of whom 2.2% were completely deaf. Just 0.5% of respondents reported multiple impairments (see Table 2).
Table 2
Types and level of disability as reported by participants.
| TYPES AND LEVEL OF DISABILITY | FREQUENCY (n) | PERCENT (%) |
|---|---|---|
| Visual Impairment | 288 | 36.7 |
| Total blindness | 211 | 26.9 |
| Partially sighted without visual aids | 40 | 5.1 |
| Partially sighted with visual aids | 37 | 4.7 |
| Hearing Impairment | 32 | 4.1 |
| Profoundly deaf | 17 | 2.2 |
| Hard of hearing without hearing aids | 11 | 1.4 |
| Hard of hearing with hearing aids | 5 | 0.6 |
| Motor Difficulty | 464 | 59.2 |
| Physical disability, using wheelchair for most or all mobility | 28 | 3.6 |
| Physical disability, requiring aids for independent mobility (e.g., brace, prosthetic device, crutch) | 204 | 26.0 |
| Physical disability, not requiring mobility aids | 237 | 30.2 |
| More than one Impairment | 5 | 0.6 |
| Visual impairment and motor difficulty | 4 | 0.5 |
| Visual impairment, hearing impairment, and motor difficulty | 1 | 0.1 |
Most of the impairments reported were acquired after birth, with just about 11% being congenital. The most reported source of impairment (43.8%) was disease/illness or other related causes, with 33% of impairments being acquired through accidents. While most of the disease/illness sources were ‘unspecified’ diseases or illnesses, ‘other’ sources included vetch (also known as ‘Guaya’ in the local language and referring to infection by a toxic substance, at 2.7%), light reflection (2.2%), and medical error or complications (1.7%). The causes of accidental impairment most commonly occurred in the home or residential area (23.6%). War and conflict, as well as car accidents, were also reported, accounting for 4.0% and 2.8% of all impairments, respectively. Table 3 details all reported causes of impairment. In terms of social circumstances, 6.5% of the 451 who were married had a partner with a disability (see Table 3).
Table 3
Self-reported onset and causes of impairment.
| VARIABLES | FREQUENCY (n) | PERCENT (%) |
|---|---|---|
| Time impairment first occurred | ||
| Acquired | 700 | 89.3 |
| Congenital | 84 | 10.7 |
| Presence of additional impairments? | ||
| Yes | 18 | 2.3 |
| No | 766 | 97.7 |
| Cause of impairments | ||
| 1. Accident (n = 261) | ||
| Accident around residential areas | 185 | 23.6 |
| Accident at workplace | 15 | 1.9 |
| Car accident | 22 | 2.8 |
| War/conflict | 31 | 4.0 |
| Accident around home/residential area and disease/illness | 8 | 1.0 |
| 2. Disease and related causes (n = 343) | ||
| Disease/illness | 292 | 37.2 |
| Medical error/complication | 13 | 1.7 |
| Light reflection (local word ‘Mich’) | 17 | 2.2 |
| Vetch (local word ‘Guaya’) | 21 | 2.7 |
| 3. Unknown causes (n = 180) | 180 | 23.0 |
History and current educational status
Approximately 70.5% and 80.6% of PwD received their first and second cycle education from integrated or inclusive schools, respectively. Only 17.3% and 10.6% of participants received their first and second cycle education from full-service boarding schools or special schools/classes (10% and 6%, respectively). A small number of impairments that happened after the first and second cycle schools accounted for 2.3% and 2.9% of the overall sample (see Figure 1).
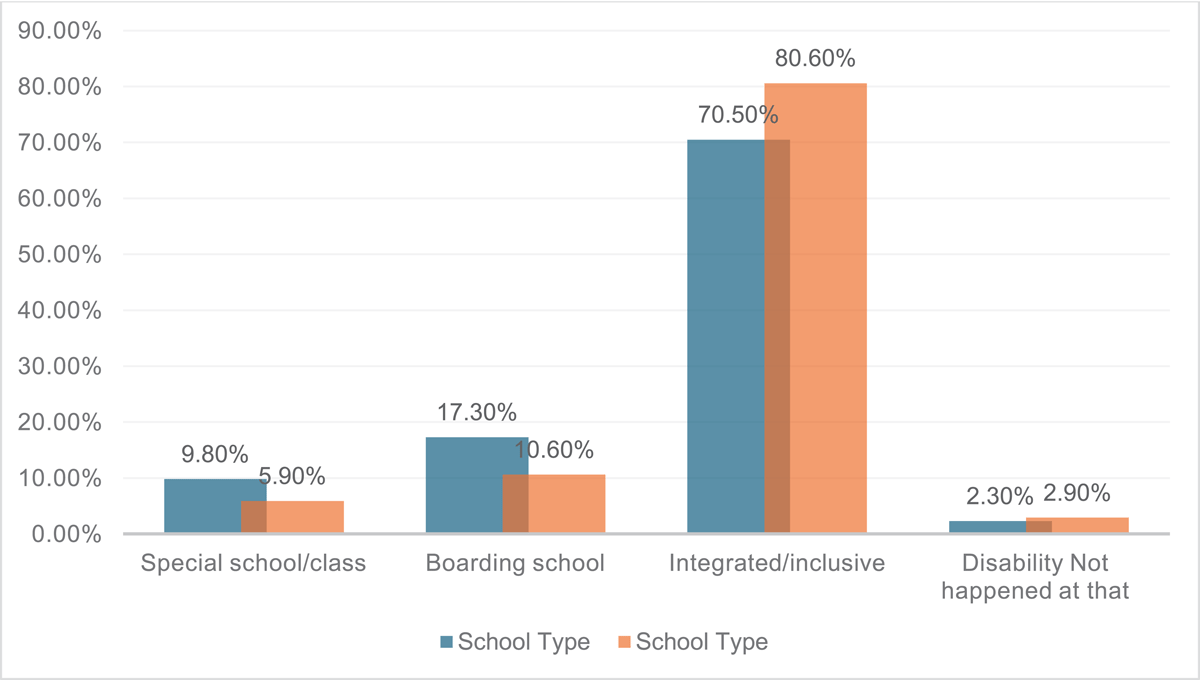
Figure 1
First and second cycle school type attended by participants.
Over two-thirds of participants (67.7%) were first-degree holders, about one-quarter held a diploma, and only 6.9% had a master’s degree (see Figure 2).
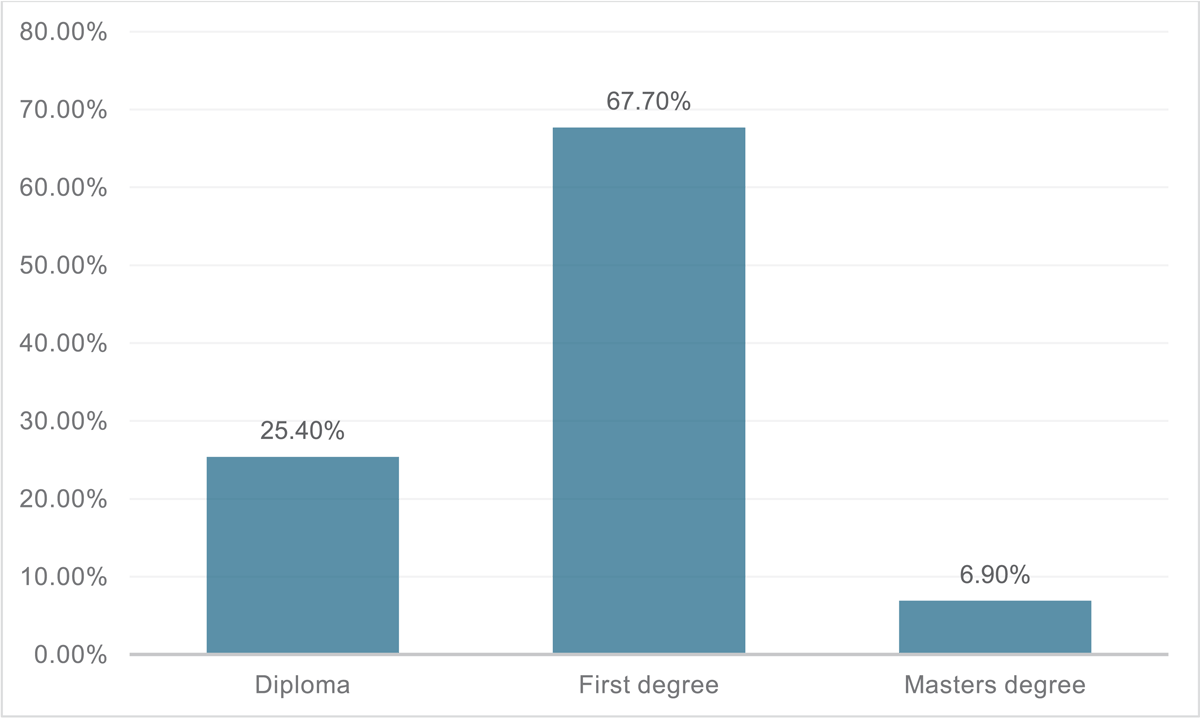
Figure 2
Educational status of the study participants.
Transition to employment
More than half of respondents (54%) reported significant challenges in obtaining meaningful employment. The most frequently cited barrier was discriminatory content in vacancy announcements (40%), while other factors were less commonly reported. Information gaps regarding available vacancies (15%) and limited accessibility of vacancy postings (12%) were also reported as key challenges (see Table 4).
Table 4
The most challenging aspects of the job securing process.
| VARIABLES | FREQUENCY RESPONSES n (%) | ||
|---|---|---|---|
| Process of securing a meaningful job for PWD in Ethiopia | Easy | 7 (0.9) | |
| Average | 75 (9.6) | ||
| Challenging | 280 (35.7) | ||
| Very challenging | 422 (53.8) | ||
| Job securing process challenges | 1st choice | 2nd choice | 3rd choice |
| Discriminatory content of vacancy announcements | 313 (39.9) | 143 (18.2) | 132 (16.8) |
| Inaccessibility of available vacancy announcements | 92 (11.7 | 138 (17.6) | 154 (19.6) |
| Information gap on available vacancies | 116 (14.8) | 116 (14.8) | 128 (16.3) |
| Lack of job opportunities in the field | 49 (6.3) | 67 (8.5) | 93 (11.9) |
| Lack of job search skills (CV writing, interviewing, etc.) and Lack of self-motivation to search | 30 (3.8) | 76 (9.7) | 95 (12.1 |
| Negative attitude of employers | 102 (13.0) | 162 (20.7) | 100 (12.8) |
More than half of the participants (56.1%) had been out of work for more than three months before securing their current job. About 21% had been unemployed for less than six months, while 13% had been unemployed for more than a year and a half. The mean time spent unemployed before securing the current job was 15.41 (95% CI, 13.57–17.25) months.
Although 58.5% of employees were working at the first organization in which they were hired, approximately 9% had worked at more than three organizations. Dissatisfaction with salaries and benefits (4.7%), workplace discrimination (2.0 %), and poor accommodation of disability needs (2.0%) were the most frequently reported reasons for leaving a previous job. The median work experience ranged from 5.0 to 6.5 years. Approximately 33.2% of respondents had worked for less than three years, while 24.1% had worked for more than nine years.
About half of the participants indicated that they had received sufficient support and guidance in their job search. Only 11.5% of respondents received special training related to job seeking at the end of their university education, which included various combinations of skills related to job acquisition. A majority of respondents (61.5%) indicated that they had at times felt frustrated with their job prospects. In response, 53.6% reported attempting to negotiate workplace accommodations, yet only 9.7% received assistance, and 5.1% benefited from a special program (see Table 5).
Table 5
Employment history and current employment status of PwDs.
| VARIABLES | FREQUENCY (n) | PERCENT (%) |
|---|---|---|
| Unemployment experiences (before securing your current job for at least 3 months and above) | ||
| Yes | 440 | 56.1 |
| No | 344 | 43.9 |
| Number of previous jobs | ||
| 0 | 459 | 58.5 |
| 1 | 191 | 24.4 |
| 2 | 65 | 8.3 |
| ≥3 | 69 | 8.8 |
| Reasons for leaving your previous job | ||
| Discrimination in the workplace and related reasons | 16 | 2.0 |
| Dissatisfied with salary and benefits | 37 | 4.7 |
| Poor accommodation | 16 | 2.0 |
| Working experience at current job | ||
| Mean (95%CI) | 6.96 (6.51–7.42) | |
| <3 years | 260 | 33.2 |
| 3–5 years | 159 | 20.3 |
| 5–9 years | 176 | 22.4 |
| >=9 years | 189 | 24.1 |
| Monthly salary (gross) in Ethiopian Birr (ETB) | ||
| Mean (95% CI) | 6073.0 (6360.53–7055.56) | |
| <4000 ETB | 222 | 28.3 |
| 4000–6000 ETB | 161 | 20.5 |
| 6000–8000 ETB | 187 | 23.9 |
| >=8000 ETB | 214 | 27.3 |
| Did you receive any special training at the end of university education? | ||
| Yes | 90 | 11.5 |
| No | 681 | 86.9 |
| Not applicable | 13 | 1.7 |
| Types of special training (n = 90) | ||
| Job hunting, resume preparation/CV writing, and job interview skills | 24 | 3.1 |
| Resume preparation/CV writing | 32 | 4.1 |
| Resume preparation/CV writing and job interview skills | 34 | 4.3 |
| Question Items | Yes n (%) | No n (%) |
| Did you receive sufficient support and guidance from graduate university in the job search process? | 395 (50.4) | 389 (49.6) |
| Were there specific occasions or times that you felt frustrated or lost hope in securing a job? | 482 (61.5) | 302 (38.5) |
| Have you ever needed to negotiate with an employer regarding workplace accommodations? | 420 (53.6) | 364 (46.4) |
| Did you receive any assistance with those negotiations from the respective department in your organizations? | 76 (9.7) | 344 (43.9) |
| Did you take advantage of any special programs to facilitate job access? | 41 (5.2) | 743 (94.8) |
Nearly half of participants (48%) perceived no gender difference in the job search process, while slightly more than one-third (33%) believed men found jobs more easily. Similarly, 58.7% of respondents reported that people residing in urban areas had an advantage in finding employment, compared to 38.6% who saw no such difference. Approximately 60% of respondents indicated that job accessibility differs by disability type, perceiving individuals with mobility and visual impairments as having more employment opportunities than those with hearing impairments (see Figure 3).
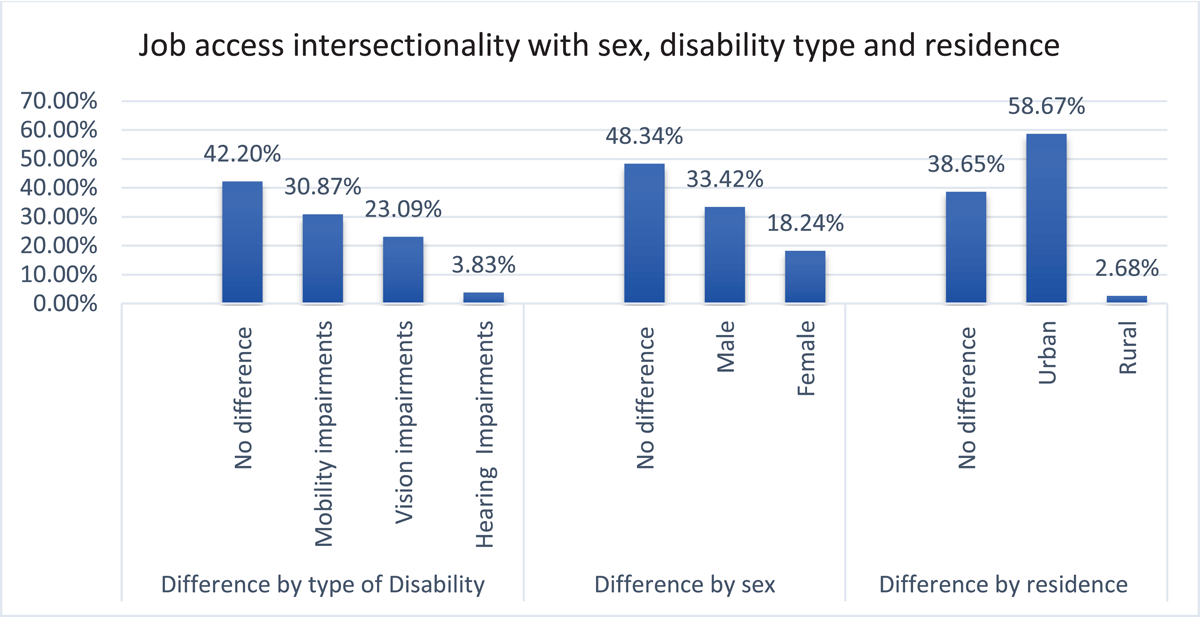
Figure 3
Perceived intersectionality between job search success and sex, residence, disability type, and school type attended.
The educational status of those with visual impairments was found to be higher than for the other impairment types. Out of the respondents with visual impairments, 76% held a first degree, while 63% of those with hearing and motor impairments held a first degree. Most of the diploma holders (34%) were those with hearing impairments, as compared with only 15% for those with visual impairments.
Employment experiences
Most of the study participants (59%) were working at a district level, followed by those working at regional bureaus and the Addis-Ababa city administration (33%). Those who worked at federal government offices account for only 1% of the sample. The median gross monthly salary was 6073 Birr (range of 1585–76625 Birr) (see Figure 4).
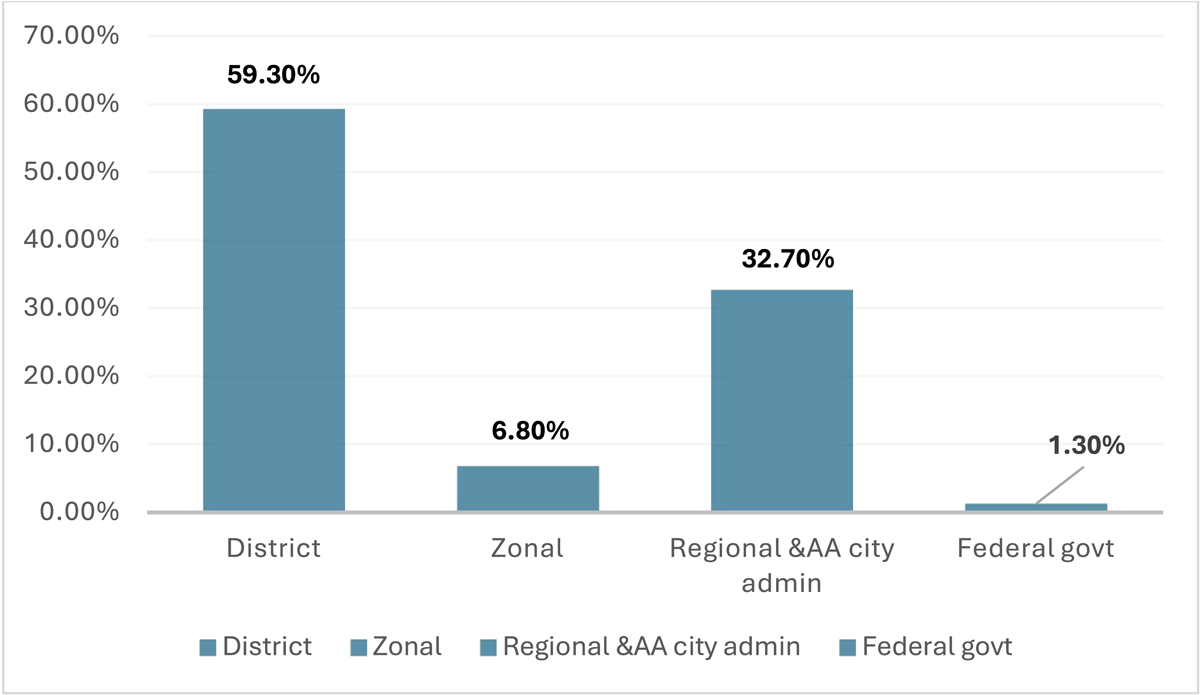
Figure 4
Employment place of respondents.
Leadership participation of respondents
The leadership participation of the respondents was minimal. Among the respondents, 84.2% were not currently in positions of leadership, and 74% have never held any such position. Of those who were in positions of leadership at the time of interviewing, most were in low- (8.2%) or medium-level (5.6%) leadership positions (see Figure 5).
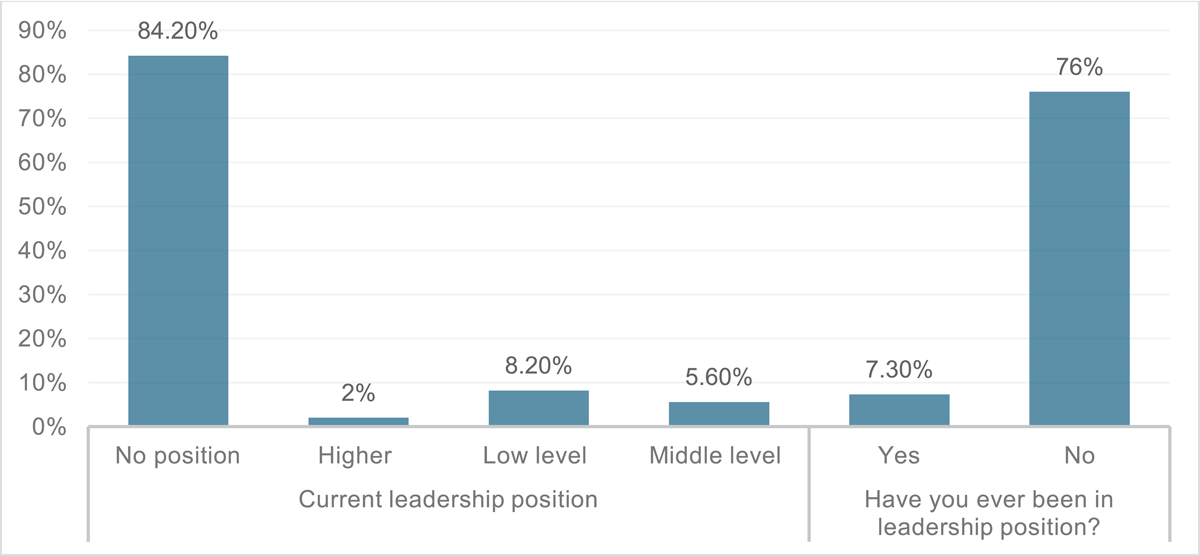
Figure 5
Leadership participation of study participants.
Relationship between socio-demographic status and disability type
The cross-tabulation between types of impairment and gender, age, educational status, unemployment history, and leadership positions was computed. Significant relationships were observed between types of impairments and both educational status (χ2 = 28.96, p = 0.00) and unemployment history (χ2 = 22.94, p = 0.00). Regarding employment history, people with motor difficulties were more likely than those with other types of impairment to have prolonged periods of unemployment (i.e., over 18 months) (see Table 6).
Table 6
Cross-tabulations of some socio-demographic variables and types of disabilities.
| VARIABLES | TYPES OF IMPAIRMENTS n (%) | χ2 VALUE | ||||
|---|---|---|---|---|---|---|
| VISUAL | HEARING | MOTOR | ≥ONE | |||
| Age categories (in years) | 21–28 | 71 (9.1) | 14 (1.8) | 119 (15.2) | 0 | 9.08 |
| 28–33 | 78 (9.9) | 8 (1.0) | 126 (16.1) | 2 (0.3) | ||
| 33–40 | 72 (9.2) | 7 (0.9) | 113 (14.4) | 1 (0.1) | ||
| 40–62 | 62 (7.9) | 3 (0.4) | 106 (13.5) | 2 (0.3) | ||
| Educational status | Diploma | 42 (5.4) | 11 (1.4) | 143 (18.2) | 3 (0.4) | 28.96** |
| First degree | 218 (27.8) | 20 (2.6) | 291 (37.1) | 2 (0.3) | ||
| Master degree | 23 (2.9) | 1 (0.1) | 30 (3.8) | 0 | ||
| Unemployment history (in months) | <6 | 68 (15.5) | 10 (2.3) | 87 (19.8) | 0 | 22.94** |
| 6–12 | 52 (11.8) | 3 (0.7) | 88 (20.0) | 1 (0.2) | ||
| 12–18 | 7 (1.6) | 1 (0.2) | 22 (5.0) | 0 | ||
| ≥18 | 19 (4.3) | 5 (1.1) | 75 (17.0) | 2 (0.5) | ||
| Leadership position | No position | 248 (31.6) | 27 (3.4) | 381 (48.6) | 4 (0.5) | 16.53* |
| Higher | 5 (0.6) | 0 | 10 (1.3) | 1 (0.1) | ||
| Low level | 22 (2.8) | 3 (0.4) | 39 (5.0) | 0 | ||
| Middle level | 8 (1.0) | 2 (0.3) | 34 (4.3) | 0 | ||
| Gender | Male | 192 (24.5) | 19 (2.4) | 312 (39.8) | 3 (0.4) | 1.05 |
| Female | 91 (11.6) | 13 (1.7) | 152 (19.4) | 2 (0.3) | ||
[i] Note: *p < 0.05; **p < 0.01.
Workplace accommodation
Most respondents identified two key accommodations needed for employment: accessible office facilities, including office space, furniture, and computers (97.1%), and modifications to the physical environment, such as roadways, offices, and toilets (93.2%). In contrast, human supports such as qualified readers/sign language interpreters and personal office assistants were the two lowest-ranked items, but were still reported as necessary by 51.4% and 59.3% of respondents, respectively.
Respondents indicated that some of these needed accommodations were provided more than others, notably improving the accessibility of office facilities (reported by 37.4%) and job restructuring (almost 36%). Modification of written documents, such as exams or training materials, was reported by 33% as having been provided, and almost 31% reported they were moved into an appropriate vacant position (see Table 7).
Table 7
Workplace accommodations and reported overall need/provision.
| ACCOMMODATION ITEMS | RESPONSES n (%) | ||
|---|---|---|---|
| NEEDED BUT NOT PROVIDED | NEEDED AND PROVIDED | NOT NEEDED | |
| Make necessary office facilities (e.g., office space, furniture, computer accessible) | 468 (59.7) | 293 (37.4) | 23 (2.9) |
| Restructure job (redistributing job among coworkers or reassigning in accessible site) | 358 (45.7) | 281 (35.8) | 145 (18.5) |
| Modify or allow flexible work hours | 383 (48.9) | 183 (23.3) | 218 (27.8) |
| Modify or allow flexible training hours | 476 (60.7) | 112(14.3) | 196 (25.0) |
| Make a reassignment into a vacant position | 403 (51.4) | 240 (30.6) | 141 (18.0) |
| Acquire/modify equipment or devices (computer with JAWS, braille, hearing aid, mobility assistive, etc.) | 548 (69.9) | 119 (15.2) | 117 (14.9) |
| Acquire/modify examination or training materials, work documents | 418 (53.3) | 259 (33.0) | 107 (13.6) |
| Provide qualified readers/sign language interpreters | 303 (38.6) | 92 (11.7) | 389 (49.6) |
| Provide personal assistance at office | 359 (45.8) | 106 (13.5) | 319 (40.7) |
| Being flexible with human resource policies | 531 (67.7) | 169 (21.6) | 84 (10.7) |
| Change supervisory methods (performance evaluation standard, threshold variation, etc.) | 479 (61.1) | 207 (26.4) | 98 (12.5) |
| Transportation accommodations or provide parking | 667 (85.1) | 55 (7.0) | 62 (7.9) |
| Modify the work physical environment (campus, roadways, office, toilet, etc.) | 598 (76.3) | 133 (17.0) | 53 (6.8) |
Several accommodations that were reported to be necessary were identified as not being provided by employers. Highest on this list was transportation and parking, identified by 85% of survey respondents. The next most unmet needs were physical modifications to the environment (inside or outside of the actual workspace) at just over 73%, acquisition of adaptive equipment and devices (70%), and use of flexible human resources policies (68%).
Impact of gender and educational status on workplace accommodation
Concerning gender and accommodations, most cross-tabulations yielded no significant difference. A significant difference was observed, however, with respect to personal assistance being available at the office (χ2 = 7.67, p = 0.02), with males being more likely to receive the needed accommodation (see Table 8).
Table 8
Cross-tabulation of list of accommodations by sex of participants.
| ACCOMMODATIONS | GENDER | TOTAL | χ2 TEST | P-VALUE | ||
|---|---|---|---|---|---|---|
| MALE | FEMALE | |||||
| Make necessary changes to office facilities | Needed but not provided | 301 (38.4) | 167 (21.3) | 468 (59.7) | 4.13 | 0.13 |
| Needed and provided | 208 (26.5) | 85 (10.8) | 293 (37.4) | |||
| Job restructuring | Needed but not provided | 234 (29.8) | 124 (15.8) | 358 (45.7) | 0.90 | 0.63 |
| Needed and provided | 192 (24.5) | 89 (11.4) | 281 (35.8) | |||
| Modified or flexible working hours | Needed but not provided | 244 (31.1) | 139 (17.7) | 383 (48.9) | 4.88 | 0.08 |
| Needed and provided | 124 (15.8) | 59(7.5) | 183 (23.3) | |||
| Modified or flexible training hours | Needed but not provided | 307 (39.2) | 169 (21.6) | 476 (60.7) | 3.81 | 0.15 |
| Needed and provided | 81 (10.3) | 31 (4.0) | 112 (14.3) | |||
| Making vacancy reassignment | Needed but not provided | 265 (33.8) | 138 (17.6) | 403 (51.4) | 1.66 | 0.43 |
| Needed and provided | 160 (20.4) | 80 (10.2) | 240 (30.6) | |||
| Acquiring/modifying equipment or devices | Needed but not provided | 365 (46.6) | 183 (23.3) | 548 (69.9) | .560 | 0.75 |
| Needed and provided | 79 (10.1) | 40 (5.1) | 119 (15.2) | |||
| Acquiring/modifying examination or training materials | Needed but not provided | 269 (34.3) | 149 (19.0) | 418 (53.3) | 4.06 | 0.13 |
| Needed and provided | 186 (23.7) | 73(9.3) | 259 (33.0) | |||
| Qualified readers/sign language interpreters | Needed but not provided | 208 (26.5) | 95 (12.1) | 303 (38.6) | 0.58 | 0.74 |
| Needed and provided | 60 (7.7) | 32 (4.1) | 92 (11.7) | |||
| Personal assistance at office | Needed but not provided | 224 (28.6) | 135 (17.2) | 359 (45.8) | 7.67 | 0.02 |
| Needed and provided | 71 (9.1) | 35 (4.5) | 106 (13.5) | |||
| Flexible human resource policies | Needed but not provided | 350 (44.6) | 181 (23.1) | 531 (67.7) | 1.06 | 0.58 |
| Needed and provided | 117 (14.9) | 52 (6.6) | 169 (21.6) | |||
| Change supervisory methods | Needed but not provided | 313 (39.9) | 166 (21.2) | 479 (61.1) | 1.84 | 0.34 |
| Needed and provided | 146 (18.6) | 61 (7.8) | 207(26.4) | |||
| Transportation accommodations or parking | Needed but not provided | 438 (55.9) | 229 (29.2) | 667 (85.1) | 4.52 | 0.10 |
| Needed and provided | 43 (5.5) | 12 (1.5) | 55 (7.0) | |||
| Modified the work physical environment | Needed but not provided | 393 (50.1) | 205 (26.1) | 598 (76.3) | 5.26 | 0.07 |
| Needed and provided | 90 (11.5) | 43 (5.5) | 133 (17.0) | |||
The likelihood of receiving multiple forms of workplace accommodation varied significantly by educational status. Cross-tabulations (see Table 9) indicate that, at the 0.05 significance level, higher education was associated with greater access to accommodations, including accessible office facilities, job restructuring, vacancy reassignment, modification of equipment or devices, adapted examination or training materials, qualified readers/sign language interpreters, and transportation or parking support. Across all accommodations, Master’s degree holders were most likely to benefit, while diploma holders were least likely.
Table 9
Cross-tabulation of accommodations by the educational status of the participant.
| ACCOMMODATIONS | EDUCATIONAL STATUS n (%) | TOTAL n (%) | χ2 TEST | p-VALUE | |||
|---|---|---|---|---|---|---|---|
| DIPLOMA | FIRST DEGREE | MASTER’S DEGREE | |||||
| Make necessary office facilities | Needed but not provided | 124 (15.8) | 323 (41.2) | 21 (2.7) | 468 (59.7) | 22.2 | 0.00** |
| Needed and provided | 63 (8.0) | 200 (25.5) | 30(3.8) | 293 (37.4) | |||
| Job restructuring | Needed but not provided | 110 (14.0) | 234 (29.8) | 14(1.8) | 358 (45.7) | 18.91 | 0.00** |
| Needed and provided | 52 (6.6) | 202 (25.8) | 27(3.4) | 281 (35.8) | |||
| Modify or flexible working hours | Needed but not provided | 105 (13.4) | 256 (32.7) | 22(2.8) | 383 (48.9) | 4.67 | 0.32 |
| Needed and provided | 48 (6.1) | 119 (15.2) | 16(2.0%) | 183 (23.3) | |||
| Modify or flexible training hours | Needed but not provided | 128 (16.3) | 321 (40.9) | 27(3.4%) | 476 (60.7) | 4.98 | 0.28 |
| Needed and provided | 27 (3.4) | 73 (9.3) | 12(1.5) | 112 (14.3) | |||
| Making vacancy reassignment | Needed but not provided | 121 (15.4) | 262 (33.4 | 20(2.6 | 403 (51.4) | 13.02 | 0.01* |
| Needed and provided | 52 (6.6) | 166 (21.2) | 22(2.8) | 240 (30.6) | |||
| Acquire/modify equipment or devices | Needed but not provided | 131 (16.7) | 383 (48.9) | 34(4.3) | 548 (69.9) | 11.45 | 0.02* |
| Needed and provided | 26 (3.3) | 80 (10.2) | 13(1.7 | 119 (15.2) | |||
| Acquire/modify examination or training materials | Needed but not provided | 111 (14.2) | 287 (36.6) | 20(2.6) | 418(53.3) | 12.80 | 0.01* |
| Needed and provided | 54 (6.9) | 183 (23.3) | 22(2.8) | 259 (33.0) | |||
| Qualified readers/sign language interpreter | Needed but not provided | 60 (7.7) | 221 (28.2) | 22(2.8) | 303 (38.6) | 24.06 | 0.00** |
| Needed and provided | 13 (1.7) | 68 (8.7) | 11(1.4) | 92 (11.7) | |||
| Personal assistance at office | Needed but not provided | 97(12.4) | 236 (30.1) | 26(3.3) | 359 (45.8) | 8.65 | 0.07 |
| Needed and provided | 18 (2.3) | 76 (9.7) | 12(1.5) | 106 (13.5) | |||
| Flexible human resource policies | Needed but not provided | 131 (16.7) | 366 (46.7) | 34(4.3) | 531 (67.7) | 2.37 | 0.67 |
| Needed and provided | 42 (5.4) | 113 (14.4) | 14(1.8) | 169 (21.6) | |||
| Change supervisory methods | Needed but not provided | 118 (15.1) | 334 (42.6) | 27(3.4) | 479 (61.1) | 7.65 | 0.11 |
| Needed and provided | 48 (6.1) | 140 (17.9) | 19(2.4) | 207 (26.4) | |||
| Transportation accommodations or parking | Needed but not provided | 165 (21.0) | 459 (58.5) | 43(5.5) | 667 (85.1) | 10.61 | 0.03* |
| Needed and provided | 15 (1.9) | 31 (4.0) | 9(1.1) | 55 (7.0) | |||
| Modify the work physical environment | Needed but not provided | 149 (19.0) | 407 (51.9) | 42(5.4) | 598 (76.3) | 3.10 | 0.54 |
| Needed and provided | 37 (4.7) | 90 (11.5) | 6(0.8) | 133 (17.0) | |||
[i] Note: *p < 0.05; **p < 0.01.
Physical accessibility and personal needs
Respondents were asked to rank accessibility items by selecting, in order, their top three concerns. The three most needed special supports or equipment items that were currently not available to them in the workplace were access to toilets, modifications to physical structures in buildings (e.g., gates, doorways, ramps, elevators, stairs), office equipment (e.g., computers, braille, printers, sockets, desks), and walkways. Building physical inaccessibility appeared as the first choice of most respondents, followed by a lack of needed office equipment (see Table 10).
Table 10
The most inaccessible items relative to the personal needs of respondents (n = 784).
| INACCESSIBLE ITEMS RELATIVE TO PERSONAL NEEDS | FREQUENCY RESPONSE n (%) | |||||||
|---|---|---|---|---|---|---|---|---|
| 1st CHOICE | 2nd CHOICE | 3rd CHOICE | TOTAL | |||||
| Cafeteria and other recreational centers | 26 | (3.3) | 56 | (7.1) | 63 | (8.0) | 145 | (18.4) |
| Gates/doorways/ramps/elevators/stairs | 175 | (22.3) | 132 | (16.8) | 52 | (6.6) | 359 | (45.7 |
| Meeting halls/conference rooms | 11 | (1.4) | 20 | (2.6) | 51 | (6.5) | 82 | (10.5) |
| Office equipment availability | 169 | (21.6) | 88 | (11.2) | 83 | (10.6) | 340 | (43.4) |
| Supervisor office | 32 | (4.1) | 37 | (4.7) | 41 | (5.2) | 110 | (14.0) |
| Toilets | 130 | (16.6) | 157 | (20.0 | 117 | (14.9) | 404 | 51.5 |
| Walkways | 113 | (14.4) | 100 | (12.8) | 113 | (14.4) | 326 | (41.6) |
| Workstation (e.g., upper floor, spacing, seating) | 54 | (6.9) | 81 | (10.3 | 71 | (9.1) | 206 | (26.3) |
| None | 74 | (9.4) | 113 | (14.4) | 193 | (24.6) | 380 | (48.5) |
Discussion
Challenges faced by PwDs in job acquisition
Job seekers with disabilities face multiple intersecting barriers, including gender, area of residence, type of disability, and educational background. Male job seekers were more likely to access jobs than their female counterparts. Given the deep-rooted stigma and the low socio-economic status of women in Ethiopia, it is not surprising that women with disabilities are further disadvantaged—a reality that is often true even for women without disabilities. The Rights of Employees with Disabilities Proclamation No. 568/2008 acknowledges the intersection of gender and disability and seeks to protect job seekers and employees with disabilities (EHR 2008). Yet, practice lags far behind the law. Although the findings do not directly show why gender influences employment outcomes, it is likely that being female, combined with certain impairments, presents intersecting barriers. Fear of gender-based violence may also discourage women from seeking employment opportunities far from home (Kaufman et al. 2019).
Our study also found that urban residents had better access to jobs than those in rural areas, likely because most accessible services are concentrated in cities. This urban bias may lead to rural-to-urban migration among PwD, thereby straining the already limited services in urban centers. However, this assumption requires further study. A Lebanese study of disability and employment revealed very low levels of persons who remained in rural areas, noting that most of those who did chose to work at home—a choice which greatly reduced earning potential (Wehbi and El-Lahib 2007). Tessier et al. (2024) studied transportation as an employment barrier for PwD living in Canada, noting that 40% of job applicants turn down offers due to a lack of transportation options to get there. Problems were noted to be even higher for aspiring workers in rural areas. It is likely that transportation barriers are even greater in low- and middle-income countries such as Ethiopia, where transportation infrastructure is less well developed. Solutions proposed by this group of researchers include training and disability awareness training for employers and transport providers alike.
Challenges associated with workplace accessibility seemed to vary depending on the type of impairment. For instance, respondents who are deaf and hard of hearing largely reported a lack of needed resources to support them in employment. The proportion of deaf and hard-of-hearing persons in this sample was very small, possibly reflecting both the lower prevalence of hearing-related disabilities, and these factors may in turn contribute to the lack of knowledge and support in the workplace (Seyoum 2017). Nonetheless, the findings suggest that little or no effort has been made to provide communication support during the job search process. By contrast, job seekers with visual impairments tended to have higher levels of education than other disability groups, perhaps reflecting a perceived need to obtain higher credentials. This likely contributes to their greater success in acquiring jobs.
Educational background also influenced employment outcomes. People with disabilities in this sample who completed high school often pursued higher education through either integrated or special schools. The higher proportion of integrated school graduates suggests that this pathway is both prevalent and effective, aligning with Ethiopia’s inclusive education agenda, which aims to prepare students with disabilities for integration into society and the labour market (Haye 2018). This is consistent with findings in other countries, where the value of higher education in relation to job acquisition and earnings has repeatedly been demonstrated (Ananian and Dellaferrera 2024; Jarząbek and Stolarska-Szeląg 2024; OECD 2022; Portillo-Navarro, Lagos-Rodríguez and Meseguer-Santamaría 2022).
More than half of respondents reported that the job search process was highly challenging, citing frustrations such as direct and indirect discrimination. This is a common finding in studies on employment and disability internationally. Employers may deliberately or inadvertently exclude job seekers with disabilities to avoid future accommodation responsibilities, and this may relate to cultural biases or perceived challenges of hiring PwD in the local economy (OECD 2022). More likely, however, these practices reflect a lack of awareness. Proclamation No. 568/2008 (EHR 2008), Article 5 explicitly prohibits discriminatory content in vacancy announcements.
While vacancy postings historically relied on physical notice boards—an inaccessible format for many with disabilities—most organizations now announce vacancies online (Dulle and Muluneh 2008). However, access to job information was reported as a concern. Many Ethiopian websites lack accessibility features (Taye et al. 2022), which remains a significant barrier, and some employers may use non-technological recruitment strategies that are inaccessible to some PwD. Further examination of discriminatory practices in hiring is warranted.
Nearly half of the respondents identified negative employer attitudes as a barrier to employment. Stigma toward PwD is well-documented globally and is likely also a factor in Ethiopia. Strategies to address this include educational interventions, stronger enforcement of legislation, and proactive, inclusive hiring by employers Kennedy et al. (2019). Anticipated stigma may discourage job seekers from disclosing their disability during applications or interviews (Santuzzi, Martinez and Keating 2022), preventing them from receiving necessary accommodations and undermining their work performance.
Encouragingly, few respondents reported that insufficient job opportunities or a lack of job-search skills were barriers, possibly reflecting the relatively high educational levels of the sample.
Implementation of workplace accommodations
Providing reasonable accommodations according to employee needs is the cornerstone of disability-related employment law and one of the government’s central obligations. Nonetheless, this study found that many public-sector employees with disabilities in Ethiopia do not receive adequate accommodations.
The most needed accommodation was an accessible physical working environment, encompassing facilities such as office furniture, printers, computers, phones, and braille devices. Surprisingly, requests for sign language interpreters and personal assistants were rare, even among employees who were deaf or hard of hearing. This may reflect differences in communication preferences (e.g., lip reading instead of sign language) or job roles that do not require interpreters. Similarly, some visually impaired participants did not request readers or assistants, highlighting that accommodation needs should never be assumed by employers. Further research is needed to determine whether some employees refrain from requesting accommodations because they believe these are unattainable or because they wish to avoid drawing attention to their disability.
Although some improvements in the availability of workplace accommodations were noted over time, progress is uneven and often anecdotal rather than supported by systematic data. For example, many participants still reported inaccessible office facilities. Access to transportation and parking also remained major challenges, directly affecting punctuality and job security. Article 8 of Proclamation No. 568/2008 states that disability cannot exempt an employee from responsibility if duties are not performed (EHR 2008). While intended to promote fairness, this provision may discourage employees from advocating for accommodations for fear of reprisal. The responsibility for accessible transportation lies largely with the government rather than employers, creating a gap in the implementation of universal design principles. Similarly, the cost of modifying physical work environments often falls solely on employers, which may limit progress without external funding support.
Assistive devices such as hearing aids, screen readers, and mobility aids were also insufficiently provided. Article 6 of Proclamation No. 568/2008 (EHR 2008) is ambiguous about whether employers must supply assistive devices as part of ‘working materials’, creating uncertainty. Without such support, employees may be excluded not only from daily work tasks but also from recruitment processes, such as pre-employment assessments.
A contradiction emerged in respondents’ perspectives in terms of the regulatory framework for accessibility. While they viewed disability-related laws and policies positively, they also reported inflexible human resource practices. This suggests a gap between policy on paper and its enforcement in practice. In effect, strong laws remain undermined by weak implementation.
Overall, employment without accessibility is meaningless. Without accessible environments, equipment, and technologies, PwD face disproportionate burdens, including the need for perseverance and negotiation with employers. This underscores the importance of government oversight, managerial training, and inclusive procurement policies to ensure equitable access to resources.
Intersectionality of disability, gender, and educational status with workplace accommodations
While overall gender differences in the provision of workplace accommodations were limited, a few disparities were observed. For example, male employees with disabilities were more likely than female employees to receive personal assistance. While the reason is unclear, it may relate to differences in self-advocacy or broader gender inequities in Ethiopia. Further research is required to unpack these findings.
Education level also influenced accommodation provision. Employees with higher education were more likely to receive accommodations, possibly because they were more aware of their rights and better equipped to negotiate for them. This aligns with the CRPD’s emphasis on awareness-raising (UN 2006). However, female employees—who generally had lower educational attainment—were less likely to receive accommodations, highlighting compounding disadvantages. Employers may also prioritize accommodations for highly educated employees because they are perceived as more valuable to the organization, thereby justifying the investment. Although this may seem pragmatic, it constitutes discrimination based on educational status.
Limitations
This study provides a point-in-time snapshot of the employment experiences of Ethiopian higher education graduates with physical and sensory disabilities, but several limitations must be acknowledged. First, the data are self-reported, which may introduce recall or response bias. Second, the sample focused only on individuals with visual, auditory, or locomotor impairments—disability groups that constitute the majority in Ethiopia—while excluding those with cognitive, psychosocial, or multiple disabilities whose experiences may differ significantly. Third, urban residents were overrepresented, limiting generalizability to rural populations. Fourth, only public-sector employees were included; private-sector dynamics remain unexplored. Finally, the study captured the experiences of those who successfully obtained employment, excluding individuals who faced barriers so severe that they were unable to secure work. Future research should include a broader range of disability groups, private-sector contexts, and those who did not complete higher education or transition into employment to provide a more comprehensive picture.
Conclusion
This study highlights persistent challenges in employment access and workplace inclusivity for Ethiopian higher education graduates with disabilities. Despite the existence of disability-inclusive legislation, implementation remains inconsistent, leaving many accommodation needs unmet. The findings point to the urgent need for coordinated policy measures, such as mandatory employment quotas, stronger enforcement of accessibility standards, and improved workplace infrastructure. The study contributes theoretically by demonstrating how disability, gender, and education intersect to shape employment outcomes in a Global South context. Framed through the social model and the capabilities approach, the analysis underscores both the promise and limitations of current inclusion policies. Policy recommendations include expanding inclusive education pathways, addressing gender-based inequities, and ensuring access to transportation and assistive technologies. Strengthening legislation, improving coordination among stakeholders, and ensuring the active involvement of PwD in policymaking are also critical. Implementing these measures would not only improve employment opportunities and satisfaction but also advance broader social equity and quality of life for PwD in Ethiopia.
Definition of Terms
Reasonable Accommodation: Refers to necessary and appropriate modifications or adjustments to the environment, policies, or practices that enable people with disabilities to enjoy their rights equally with others.
Inclusion: The process of ensuring that PwD are fully integrated into all aspects of society—education and employment.
Transition: Refers to the process of moving from one stage of life or setting to another, i.e., from school to work.
Impairments: Refers to physical impairments (affecting mobility or physical functioning), sensory impairments (affecting one or more senses), and/or multiple impairments (a combination of two or more types of impairments). This study does not include workers with psychosocial and learning impairments.
Data Accessibility Statement
The datasets used and/or analyzed during the current study are available from the corresponding author, T.H.M., upon reasonable request.
Ethics and Consent
Verbal informed consent was obtained before the interview, and all participants consented to anonymously publishing their data in academic journals.
Acknowledgements
The authors gratefully acknowledge the study participants and all researchers who supported and contributed to this work. We also extend our appreciation to the Mastercard Foundation Scholars Program for its financial support, and to the University of Gondar (Ethiopia) and Queen’s University (Canada) collaborative project for providing the institutional resources and facilities that made this study possible.
Disclaimer
The views and opinions expressed in this article are those of the authors and are the product of professional research. It does not necessarily reflect the official policy or position of any affiliated institution, funder or agency or that of publisher. The authors are responsible for this article’s results, findings, and content.
Competing interests
The authors reported that they received funding from The Mastercard Foundation (MCF) Scholar’s Program, Queen`s-Gondar collaborative project, which may be affected by the research reported in the enclosed publication. The author has disclosed those interests fully and has implemented an approved plan for managing any potential conflicts arising from their involvement. The terms of these funding arrangements have been reviewed and approved by the affiliated university in accordance with its policy on objectivity in research.
Author contributions
T.H.M. and R.M.L. contributed to the conceptualization. T.H.M. contributed to drafting and revising the manuscript critically for intellectual content. T.H.M. and R.M.L. ensured the integrity and accuracy of the work. All authors approved the final version to be published.