
Table 1
Dimensions and levels of the vignettes.
| DIMENSION | LEVEL |
|---|---|
| Gender | Male |
| Female | |
| Age | 26–28 |
| 40–42 | |
| 54–56 | |
| Education | Primary school |
| Secondary school | |
| Education relevant to the needs of the company | |
| Work experience | Some relevant work experience |
| Many years of relevant work experience | |
| Disability | Non-disabled (nothing mentioned in the text) |
| Wheelchair user | |
| Blind | |
| Intellectual disability | |
| Chronic illness | |
| Mental illness | |
| Hearing impairment | |
| Support measure | No measure (nothing mentioned) |
| Measure specific to type of disability | |
| Work percentage | Full time (nothing mentioned) |
| 20–30% | |
| 50% | |
| 70–80% |
[i] Note: This table has previously been published in Berre (2023): https://doi.org/10.1177/09500170231175776.
Table 2
Full description of the different types of disability.
| Wheelchair user | (Name) is a wheelchair user and could have some accommodation needs related to this. |
| Hearing impaired | (Name) has a hearing impairment. She communicates with speech and can understand what is being said in one-to-one conversations in quiet environments but must use sign language interpreters in contexts with many people present. |
| Blind | (Name) is blind and uses a guide dog. |
| Intellectual disability | (Name) has an intellectual disability/Down syndrome* and needs some extra follow-up and training in work tasks. |
| Chronic/mental illness | (Name) has a chronic/mental* illness and could have periods with reduced work capacity because of this. |
[i] Notes: *The respondent randomly received one of the two descriptions marked in italic. For intellectually disabled candidates, the two different phrasings of the impairment (‘intellectually disabled’ vs. ‘Down syndrome’) did not impact employers’ assessments and have therefore been kept as one category throughout all analyses. Chronically or mentally ill candidates have, however, been kept as two separate categories throughout all analyses due to being very different types of impairments and also because employers responded differently towards these two groups. This table has previously been published in Berre (2023): https://doi.org/10.1177/09500170231175776.
Table 3
Full description of support measures specific to the type of disability.
| Wheelchair user | ‘NAV has support that covers the company’s expenses in case of accommodation needs’ |
| Hearing impaired | ‘NAV organizes and covers all costs associated with the use of sign language interpreters’ |
| Blind | ‘NAV has support that covers the company’s expenses in case of accommodation needs related to the vision impairment’ |
| Intellectual disability | ‘If hired, NAV will offer the company to cover 80% of (Name)’s salary costs, so that the employer pays only 20%’ |
| Chronic/mental illness | ‘NAV will offer the company a permanent wage subsidy that covers 50% of (Name)’s salary costs’ |
[i] Notes: NAV = Norwegian Labour and Welfare Administration. This table has previously been published in Berre (2023): https://doi.org/10.1177/09500170231175776.
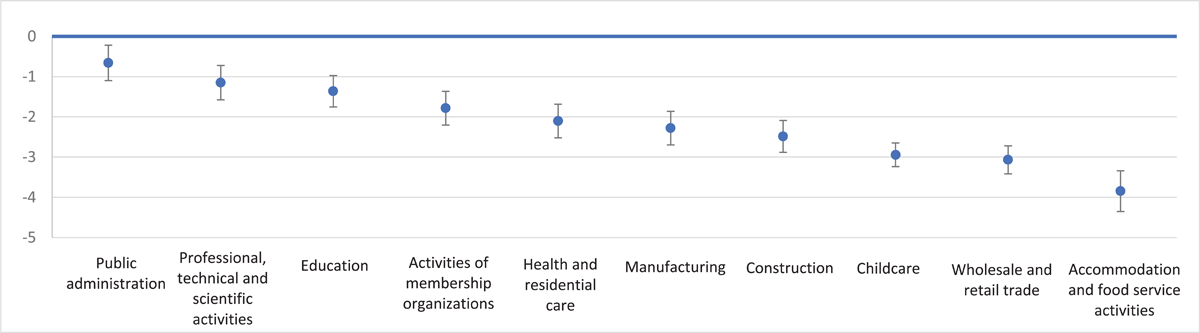
Figure 1
The impact of disability on employers’ hiring assessments, by industry. Random-slope model, marginal effects.
Notes: Average marginal effects with 95% confidence intervals obtained from a two-level random-slope model measuring the impact of disability on employers’ hiring assessment scores. The model includes an interaction term between disability and industry and a random slope for the lower-level variable of this interaction. Level 1 variables: all vignette dimensions presented in Table 1. Level 2 variables: company size/sector and type of industry. Dependent variable: employers’ hiring assessment of candidates on a scale from 0 (‘hiring highly unlikely’) to 10 (‘hiring highly likely’). The marginal effects represent how many scale points lower on the hiring assessment scale disabled people were assessed, compared to non-disabled candidates, when no support measure was mentioned in the vignettes. The vertical line is the reference category (the predictive margin of non-disabled job seekers.)
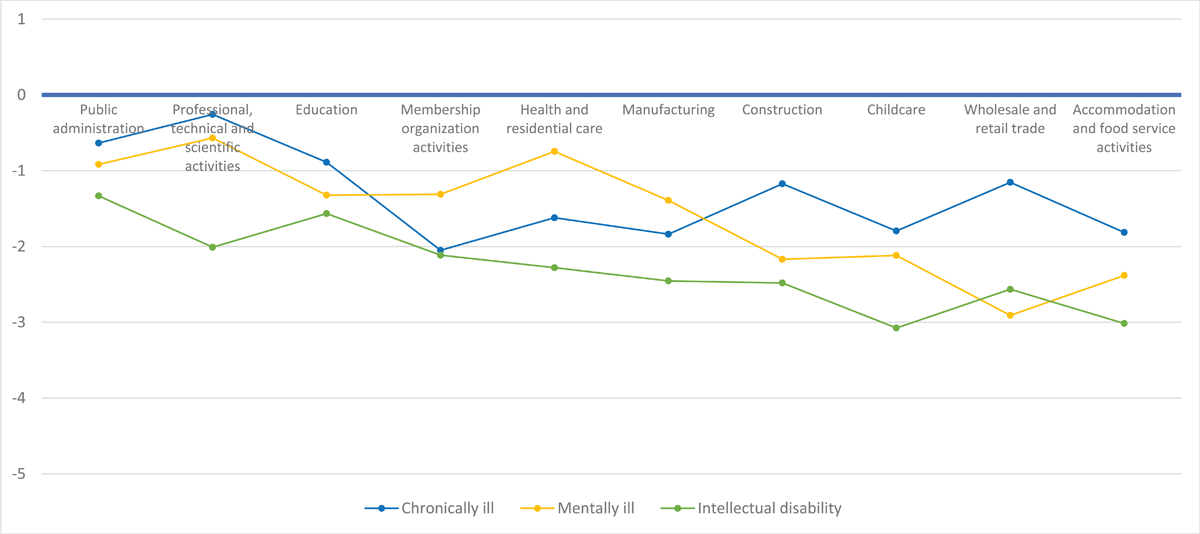
Figure 2
The impact of industry on employers’ hiring assessment of chronically ill, mentally ill, and intellectually disabled job seekers. Linear random-slope model, marginal effects.
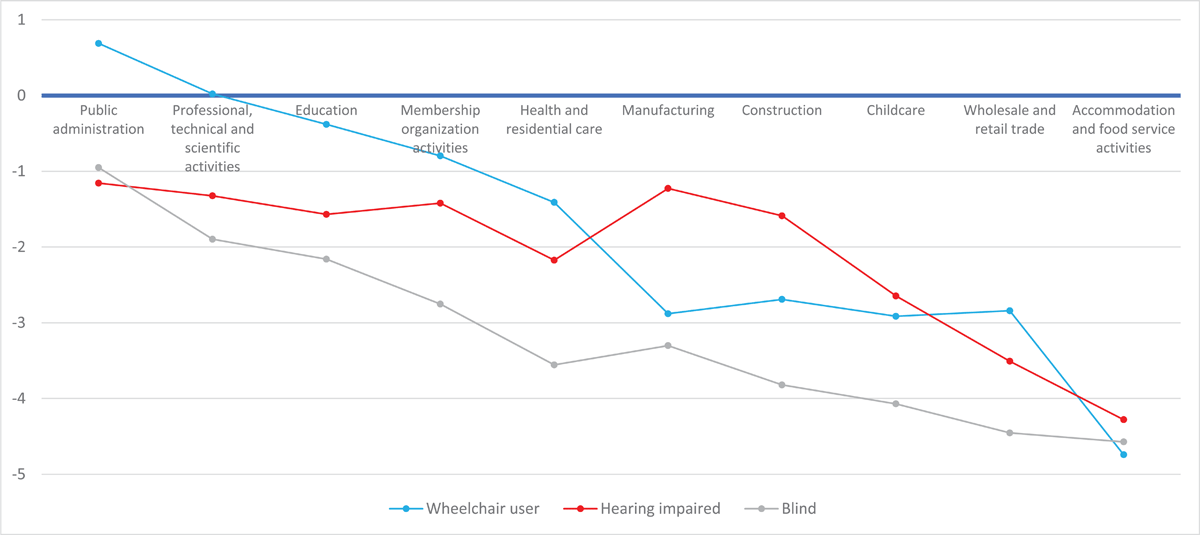
Figure 3
The impact of industry on employers’ hiring assessment of wheelchair users, hearing impaired and blind job seekers. Random-slope model marginal effects.
Notes to Figures 2 and 3: Average marginal effects obtained from a two-level random-slope model measuring the impact of different types of disability on employers’ hiring assessment scores. The model includes an interaction term between disability and industry and a random slope for the lower-level variable of this interaction. Level 1 variables: all vignette dimensions presented in Table 1. Level 2 variables: company size/sector and type of industry. Dependent variable: employers’ hiring assessment of candidates on a scale from 0 (‘hiring highly unlikely’) to 10 (‘hiring highly likely’). The blue horizontal line is the reference category (the predictive margin of non-disabled job seekers.)
Table 4
Industry differences in the impact of support measures on employers’ hiring assessments of disabled job seekers. Random-slope model, marginal effects.
| CHRONICALLY ILL | MENTALLY ILL | WHEELCHAIR USER | HEARING IMPAIRED | INTELLECTUALLY DISABLED | BLIND | |
|---|---|---|---|---|---|---|
| Public administration | 1.41* | 0.73 | 0.10 | 0.41 | 0.19 | 0.14 |
| Professional, technical, and scientific activities | 0.05 | 1.20 | 0.37 | 0.60 | 0.40 | 0.10 |
| Education | 0.98* | 1.06 | –0.04 | 0.35 | 0.14 | 0.68 |
| Activities of membership organisations | 1.54** | 0.51 | 0.12 | 0.34 | 0.41 | –0.04 |
| Health and residential care | 0.67 | 1.14** | –0.45 | 0.43 | 0.02 | 1.25*** |
| Manufacturing | 1.77** | 0.36 | 0.95* | 0.24 | 0.72 | 0.03 |
| Construction | 0.77 | 1.78** | 0.40 | –0.14 | 0.16 | 0.60* |
| Childcare | 1.45*** | 1.32** | 0.03 | 0.16 | 1.24*** | –0.12 |
| Wholesale and retail trade | 0.28 | 1.52** | –0.13 | 0.71 | 0.51 | 0.25 |
| Accommodation and food activities | 1.18 | 0.28 | 1.11* | 0.75 | –0.43 | –0.70 |
[i] Notes: ***p ≤ 0.01 **p ≤ 0.05 *p ≤ 0.10. Average marginal effects obtained from a two-level random-slope model measuring the impact of the type of disability (with and without a support measure mentioned) on employers’ hiring assessment. The model includes an interaction term between disability and industry and a random slope for the lower-level variable of this interaction. Level 1 variables: all vignette dimensions presented in Table 1. Level 2 variables: company size/sector and type of industry. Dependent variable: employers’ hiring assessment of candidates on a scale from 0 (‘hiring highly unlikely’) to 10 (‘hiring highly likely’). The marginal effects represent the change in employers’ hiring assessments of each presented group of disabled candidates when a support measure was introduced to the vignettes.