
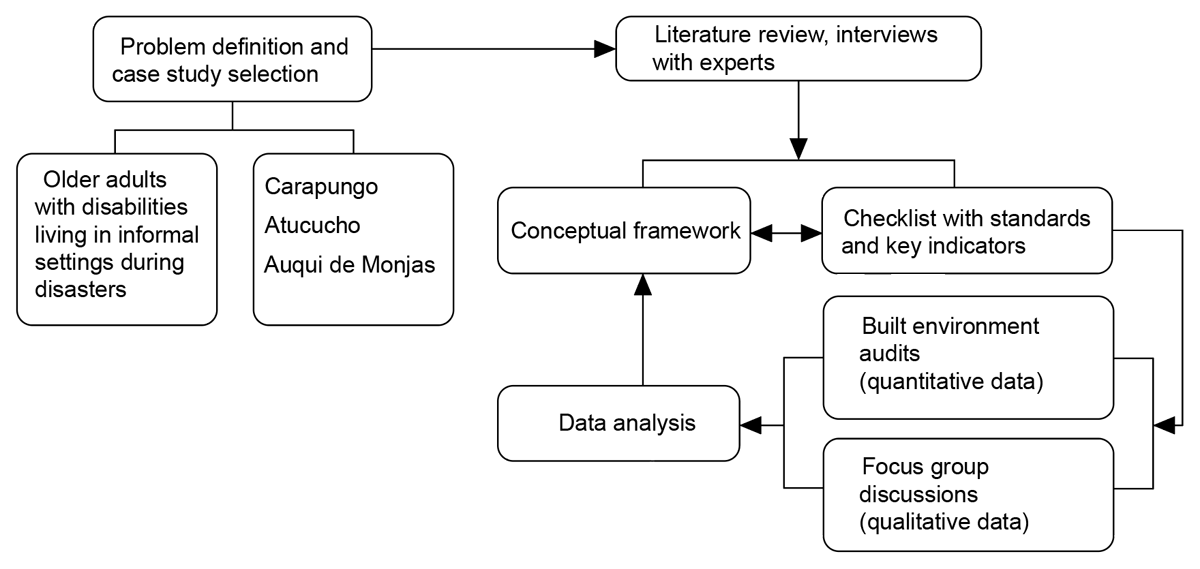
Figure 1
Activities and methods approach.
Table 1
Comparative results between case studies.
| INDICATOR NUMBER | SPATIAL NEEDS OBSERVED | CASE A | CASE B | CASE C |
|---|---|---|---|---|
| 1 | Spatial conditions required in road axes for universal accessible pedestrian mobility | 28% | 46% | 27% |
| 2 | Spatial conditions required for accessible green and public space | 27% | 47% | 42% |
| 3 | Spatial conditions required for accessible entrances to facilities | 41% | 51% | 33% |
| 4 | Availability of healthcare institution inside the exposed territory | 100% | 100% | 0% |
| 5 | Close location of the health center in relation to the dwellings in the territory (Reference distance of 200 m or 0.12 miles) | 100% | 100% | 0% |
| 6 | Close location of a hospital in relation to the affected territory | 100% | 100% | 0% |
| 7 | Street permeability between the affected territory and broader urban network | 4% | 9% | 10% |
| 8 | Lighting services along all pedestrian and vehicular axes | 100% | 100% | 50% |
| 9 | Availability of visual and auditive disaster alarms | 0% | 0% | 0% |