
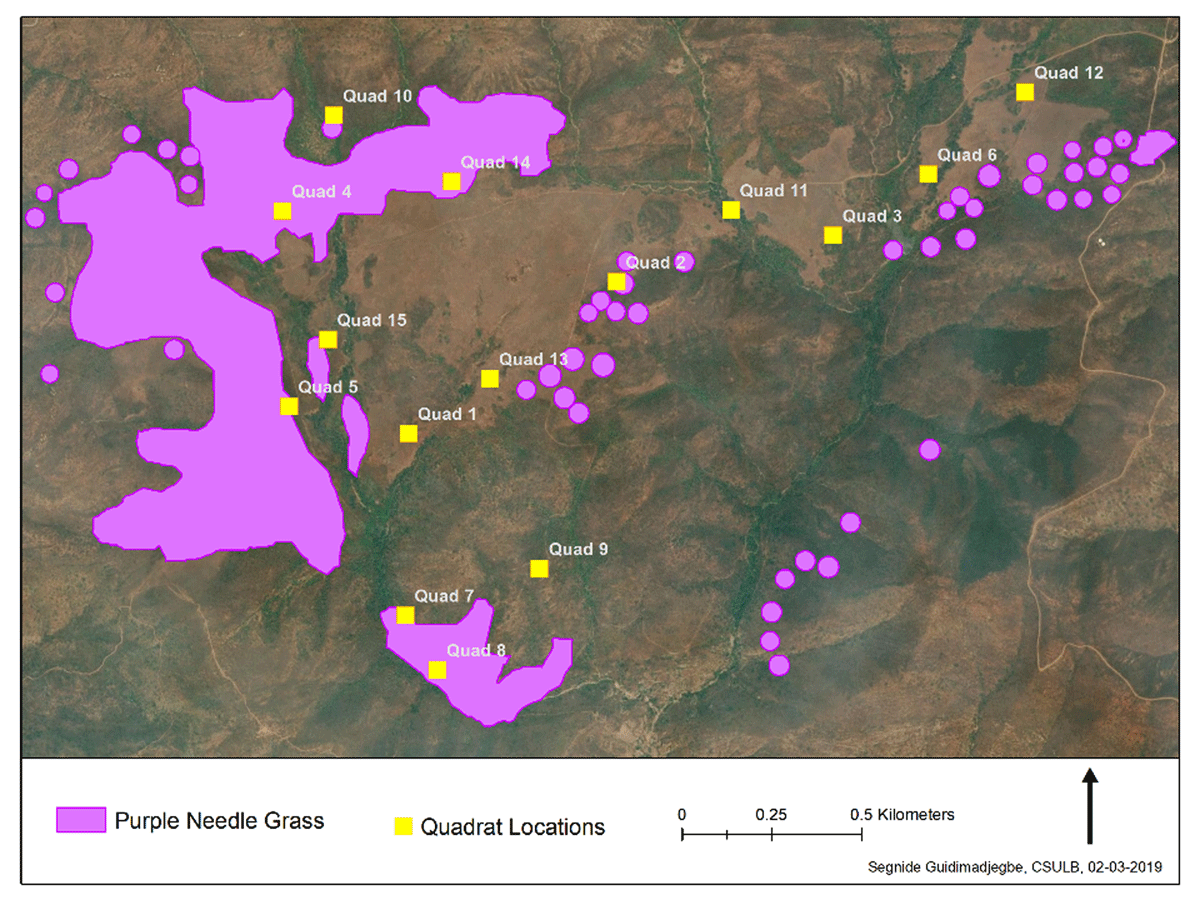
Figure 1
Quad locations from the original LJV study by Gale (1983) and Goode (1981) overlaid on historic stands and point locations of relic native bunchgrasses recreated from Barry (1972).2
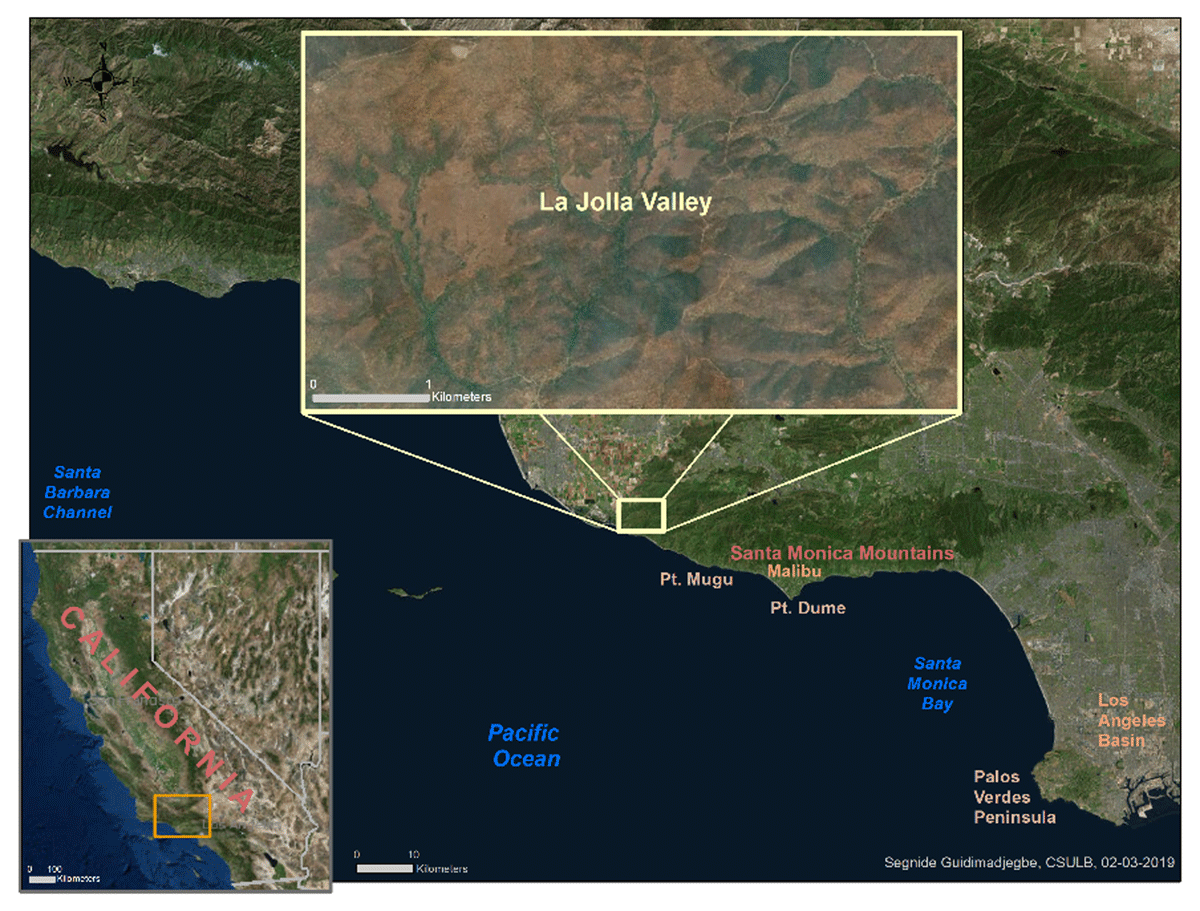
Figure 2
Location of La Jolla Valley in the Santa Monica Mountains.
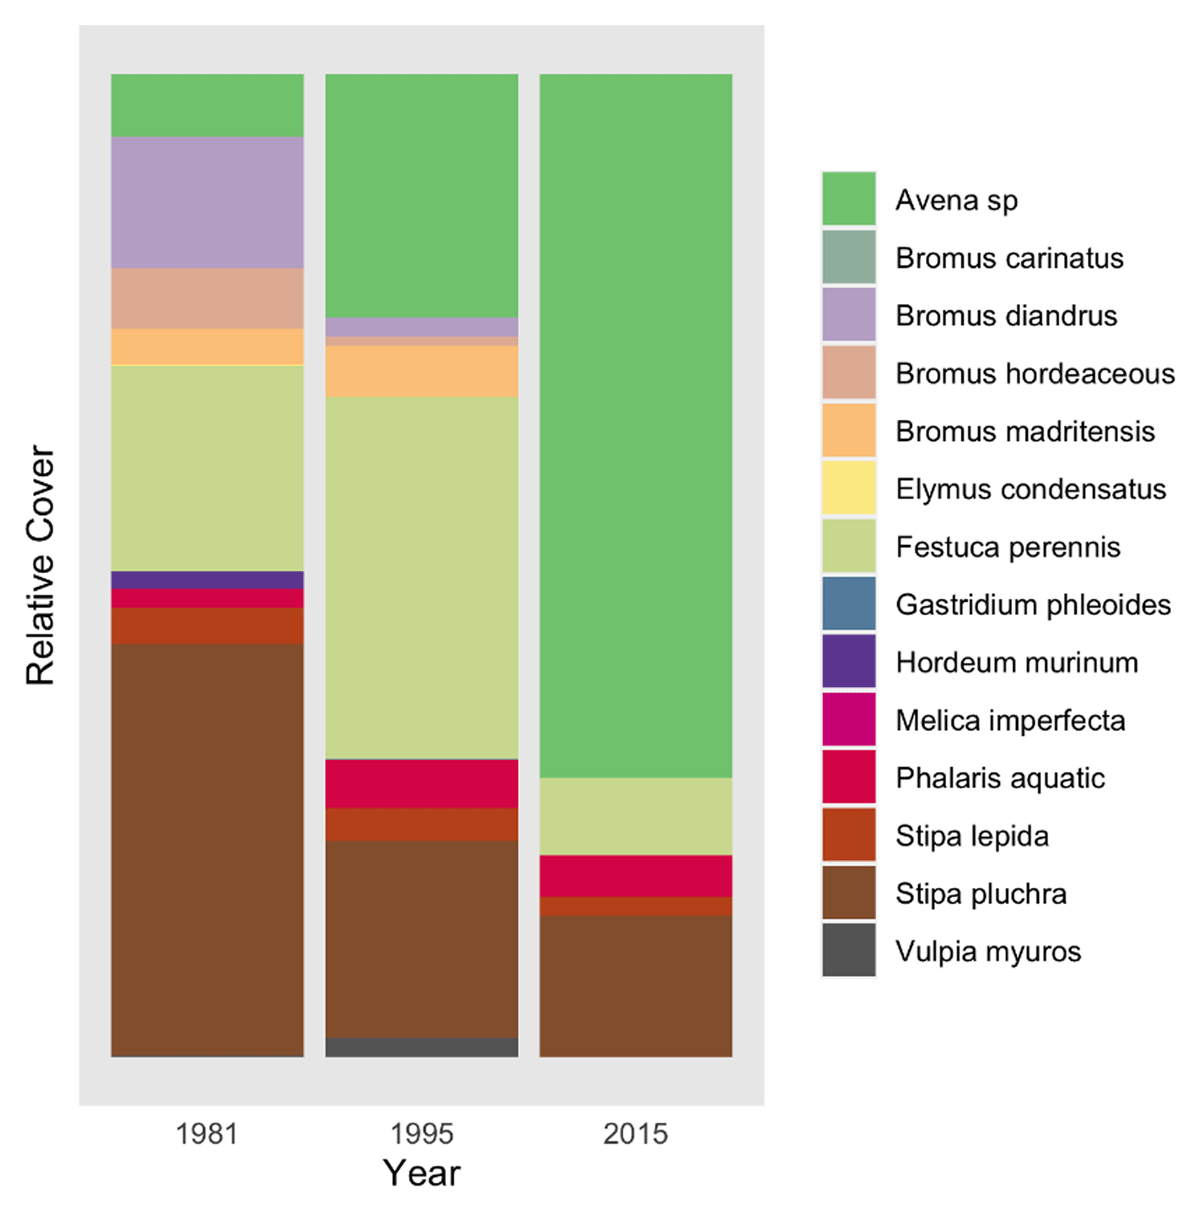
Figure 3
Percent relative cover of grasses over time in LJV.
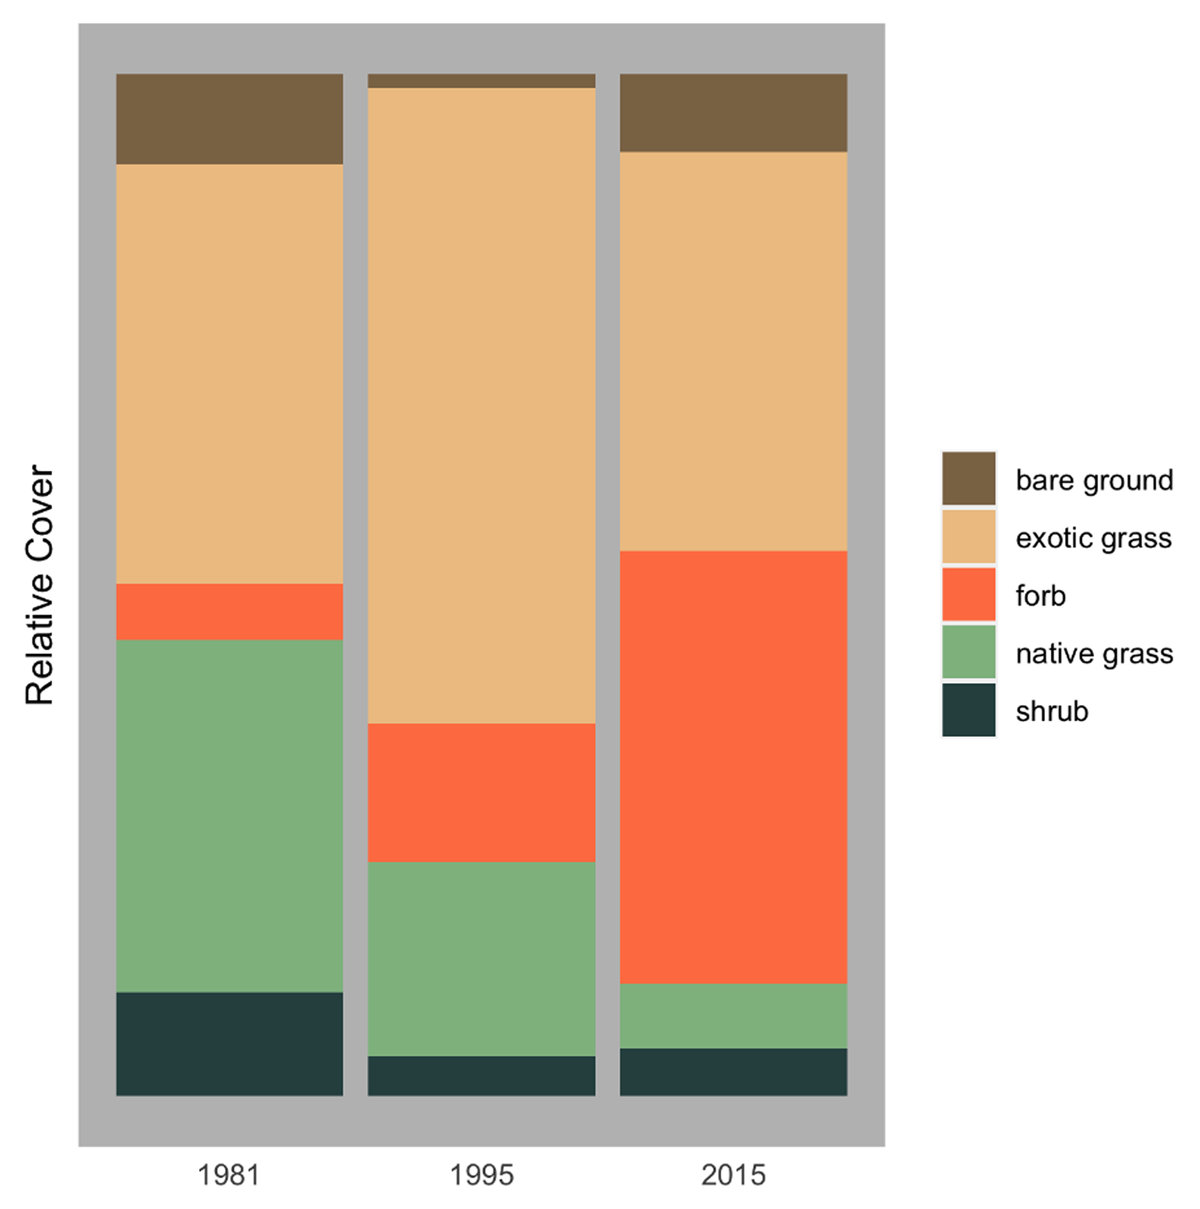
Figure 4
Changes in relative cover of native and exotic grasses, forbs, shrubs, and bare ground.
Table 1
Fisher’s Exact Test for Count Data for increase/decrease in cover of grasses and forbs by quadrat from 1981 to 2015.
| Vegetation Form | Increase | Decrease |
|---|---|---|
| Grass | 1 | 14 |
| Forbs | 14 | 1 |
[i] Fisher’s Exact Test.
P-value = 0.08008.
95% CI: 0.002183889 1.190995284.
odds ratio: 1151766.
Table 2
Fisher’s Exact Test for Count Data for increase/decrease in cover of grasses by quadrat from 1981 to 2015.
| Vegetation Form | Increase | Decrease |
|---|---|---|
| Native Grass | 1 | 14 |
| Non-Native Grass | 6 | 9 |
[i] Fisher’s Exact Test.
P-value = 0.0001157.
95% CI: 4.268043 2505.233273.
odds ratio: 45.18712.
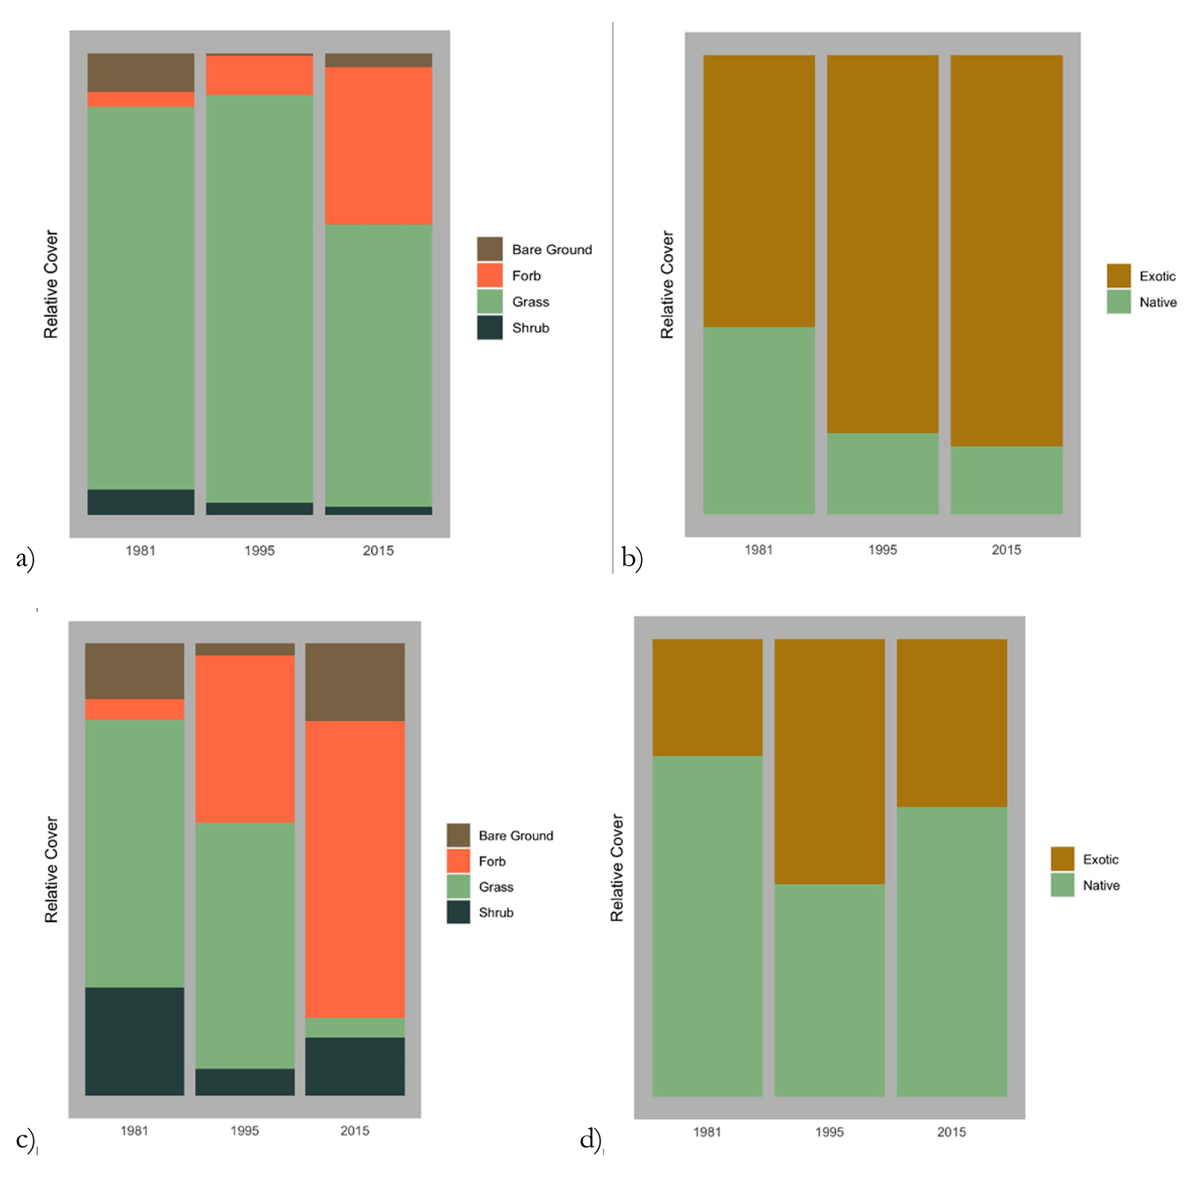
Figure 5
Percent average cover by category for floor (a, b) and edge (c, d) quadrats 1981–2015.