
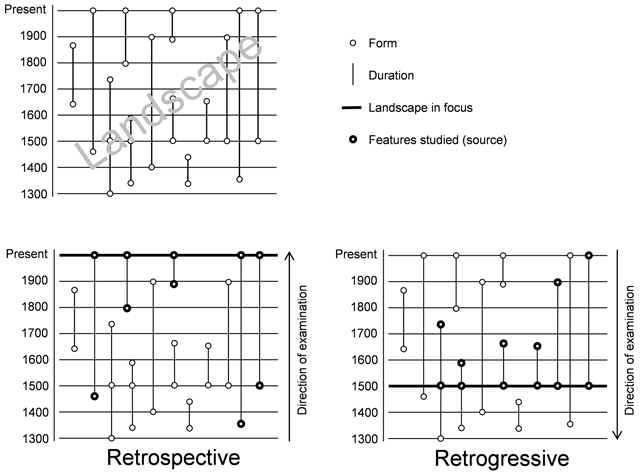
Figure 1
Notional graphs illustrating a particular landscape and its features between AD 1300 and present time. The thick line shows a cross-section in time of the studied landscape. Illustration by author, partly inspired by illustrations in Leontief (1963) and Vervloet (1984).
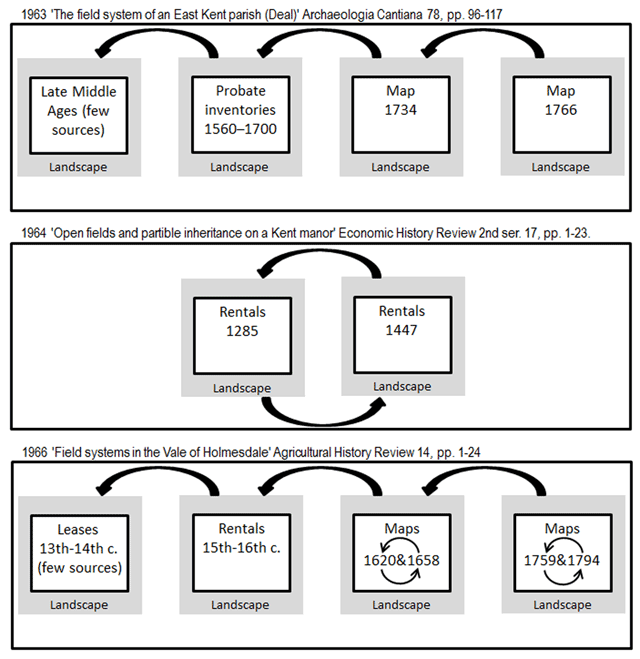
Figure 2
Author’s interpretation of Baker’s use of the retrogressive method in his three papers (1963, 1964, 1966).
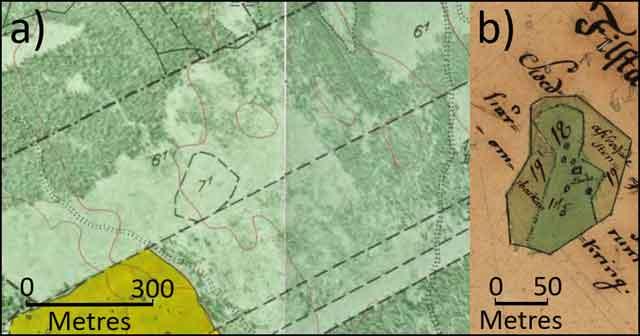
Figure 3
a) Fillstaböle marked as 71 on a printed map from 1967 (scale 1:10 000), National Archive of Sweden, map number 19E1h. b) The same area depicted on an area measurement map made by surveyor Gabriel Esping in 1745 (scale 1:4000) County Cadastral Authority Archives, map number 23-frj-10. ©Lantmäteriet Gävle 2014 (publication permit ref. I2014/00579).
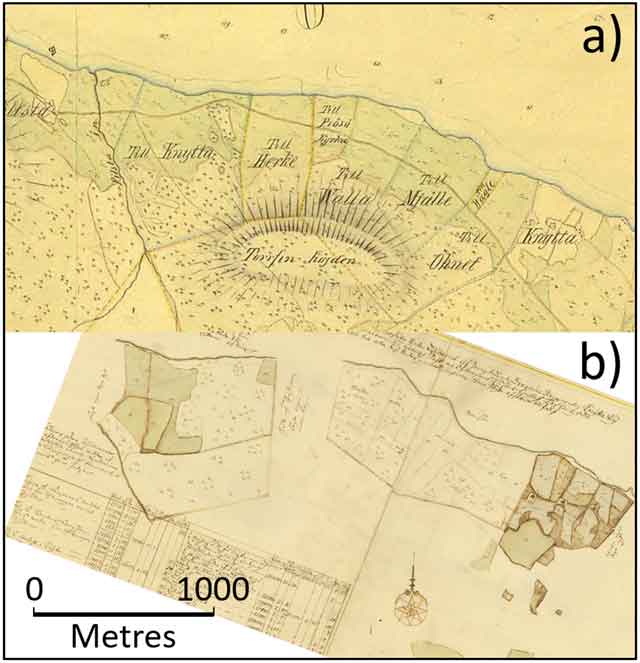
Figure 4
a) Map of the southern part of Frösö parish made by surveyor Albrekt Emanuel Behm in 1854 (scale 1:10 000), mostly showing dry meadows (coloured in green). Fields (coloured yellow) and buildings only appears to the west in Fillsta hamlet and to the east in Knytta hamlet. National Archive of Sweden, map number Y12-1:4. b) Geometric map of Knytta hamlet made by surveyor Matthias Busch in 1698 (scale 1:4000), National Archive of Sweden, map number Y12-10:1.