
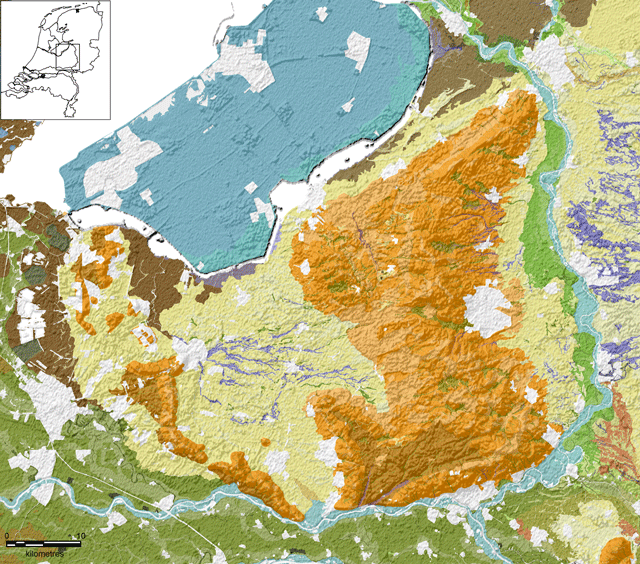
Figure 1
Section of the archaeological landscape map of the Netherlands (1:50,000) depicting the Veluwe region. Clearly visible are the characterizing high push moraines in this area (light and dark orange sections). For a detailed description of the individual landscape units, legend and background information please see Rensink et al. (2017).
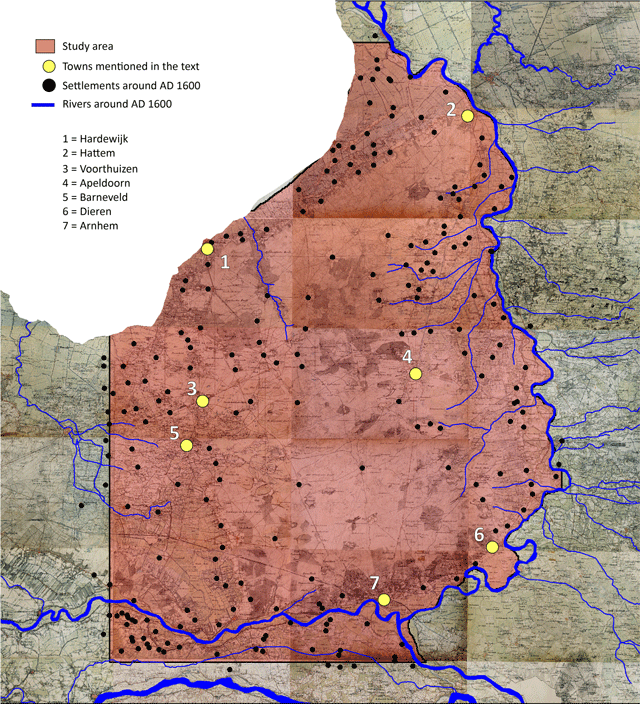
Figure 2
The research area (in red) including settlements overlaid on the Topographic Military Map 1850 (TMK 1850). Contemporary rivers are visible in blue.
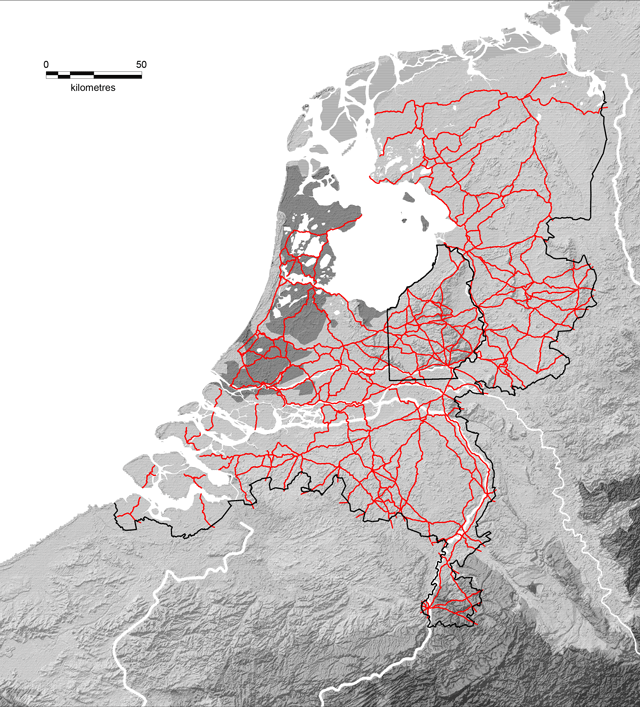
Figure 3
Road network in the Netherlands around AD 1600 reconstructed by Horsten (2005). In the present study only connection routes on the Veluwe (smaller framework) were included.
Table 1
ALS parameters used for route-network modelling.
| Meta-information ALS | |
|---|---|
| ALS-Project | Actueel Hoogtebestand |
| Purpose of Scan | Water management |
| Time of Data Acquisition | April 2010 |
| Point-distribution (pt. per sq. m) | 6–10 |
| Scanner Type | Riegl LMS-Q680i Full-Waveform |
| Scan Angle (whole FOV) | 45° |
| Flying Height above Ground | 600 m |
| Speed of Aircraft (TAS) | 36 m/s |
| Laser Pulse Rate | 100 000 Hz |
| Scan Rate | 66 000 Hz |
| Strip Adjustment | Yes |
| Filtering | Yes |
| DTM-resolution | 0.5 m |
| Interpolation method | Moving planes |
Table 2
Model design of the Veluwe network-friction model.
| Field name | Description |
|---|---|
| Grid_ID | Unique identifier for each individual grid cell |
| Grid_ID500 m | Unique identifier grid cell in larger nationwide grid |
| Unit_AD1500 | Unit of grid cell according to palaeogeographic map of AD 1500 |
| Acc_AD1500_LA | Accessibility AD 1500 based on land factors |
| Unit_Arch_La | Unit of grid cell according to geomorphological map of the Netherlands |
| Arch_LA_GeomorfCode | Original geomorphological code map of the Netherlands |
| Acc_Arch_La_LA | Accessibility geomorphology based on land factors |
| Unit_Soil | Unit of grid cell according to soil map of the Netherlands |
| Code_soil | Original code from soil map |
| Acc_Soil_LA | Accessibility based on land-factors soil map |
| Unit_GW | Original code groundwater level map |
| Acc_GW | Accessibility based on groundwater reconstructions |
| Nf_AD1500_Sum | Combined network friction sum AD 1500 |
| Nf_AD1500_AvG | Combined network friction average AD 1500 |
Table 3
Network-friction levels as defined by Van Lanen et al. (2015a).
| Description | Network-friction value |
|---|---|
| Inaccessible | 1 |
| Poorly accessible | 2 |
| Moderately accessible | 3 |
| Reasonably accessible | 4 |
| Accessible | 5 |
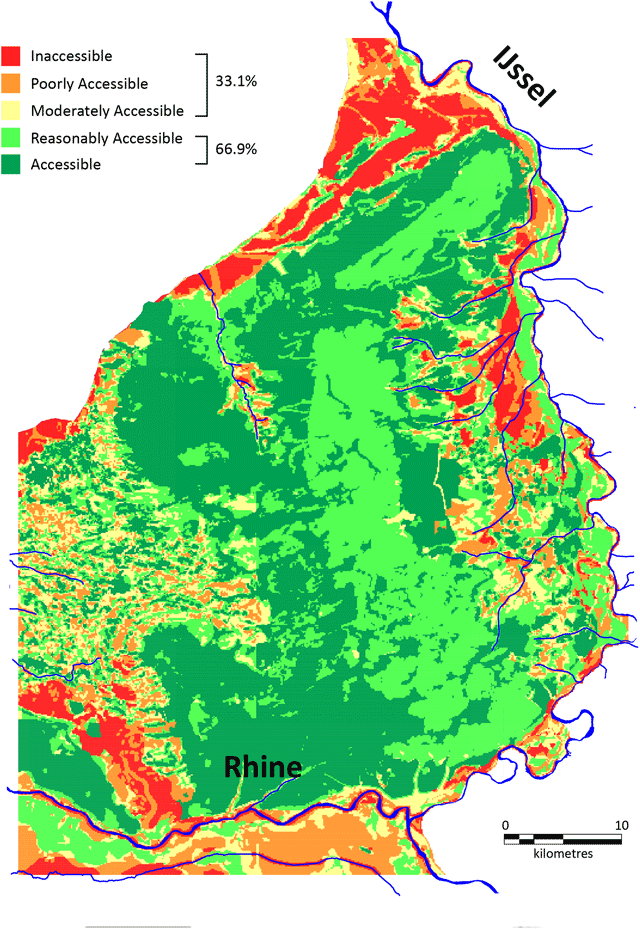
Figure 4
Network-friction map of the research area around AD 1500. Probable movement corridors are show dark green, and obstacles in red. Additional percentages of poorly and well-accessible areas are given. Major rivers (in blue) bordering the research area, the river IJssel in the east and the river Rhine to south.
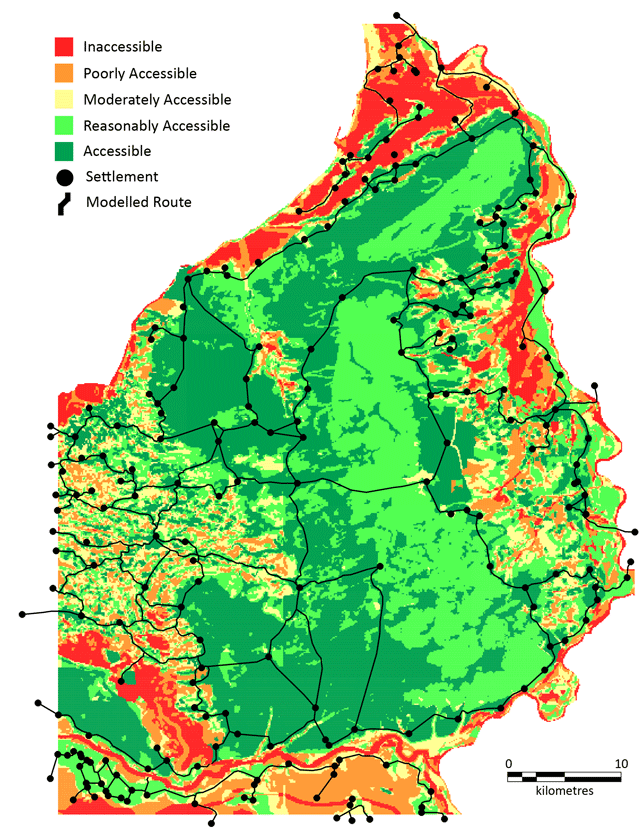
Figure 5
Route network based on the network-friction approach in the Veluwe area around AD 1500.
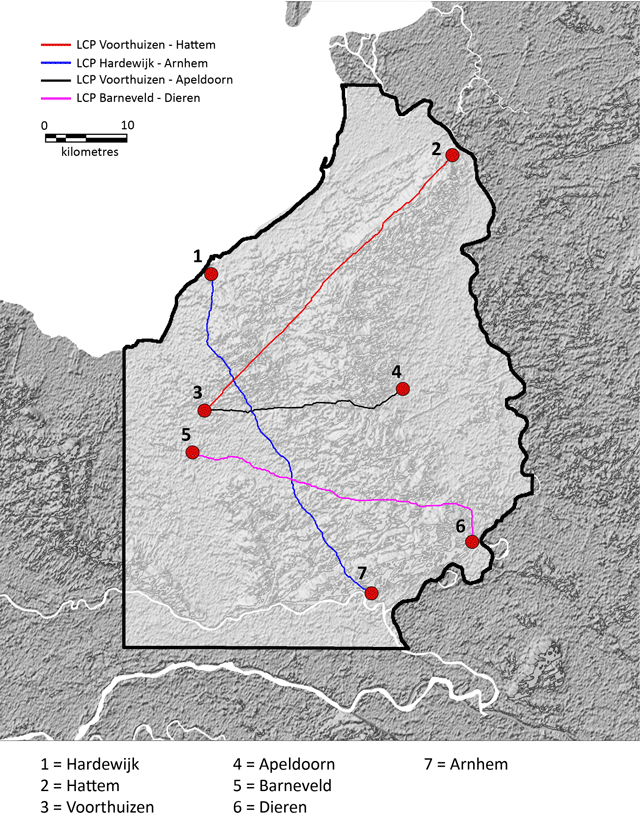
Figure 6
Least-cost path (LCP) calculated routes on the Veluwe. Four routes were preselected and modelled: 1) the LCP running from Voorthuizen to Hattem, 2) LCP running from Harderwijk to Arnhem, 3) LCP running from Voorthuizen to Apeldoorn and 4) the LCP running between Barneveld and Dieren.
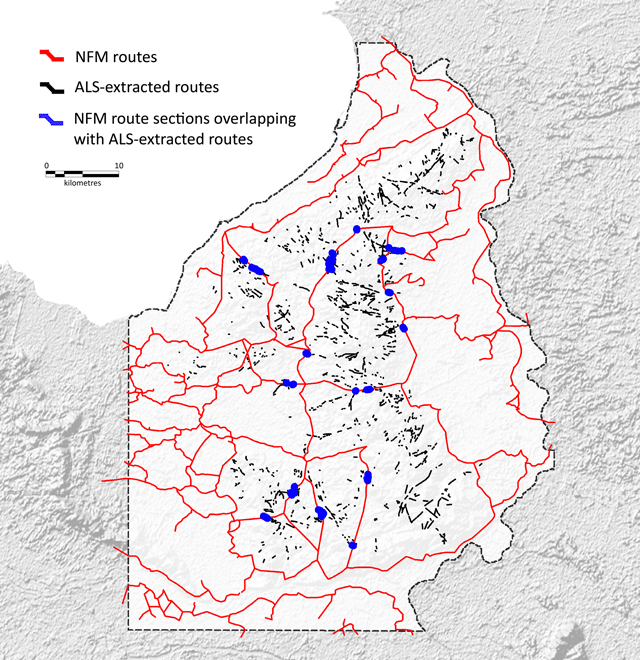
Figure 7
Hollow ways (in black) extracted from airborne laser scanner data. Sections where these hollow ways correspond with the calculated NFM-route zones (red) are highlighted in blue.
Table 4
Agreement between local accessibility based on network friction, the ALS-extracted hollow ways and the AD 1600 route network.
| Description | NFM value < = 3 | NFM value > = 3 | % NFM value < = 3 | % NFM value > = 3 |
|---|---|---|---|---|
| ALS-extracted hollow ways (in metres) | 234 | 269247 | 1.0% | 99.0% |
| AD 1600 route network (in square metres) | 1397 | 6283 | 18.2% | 81.8% |
| TMK-1850 routes (n grid cells) | 35359 | 117061 | 23.2% | 76.8% |
Table 5
Agreement between route zones (100 m wide) based on settlement data and network friction, and the ALS-extracted hollow ways, the AD 1600 route network and the TMK 1850.
| Description | No agreement with route zone (in km2) | Agreement with route zone (in km2) | % Not correlating with route zone | % Correlating with route zones |
|---|---|---|---|---|
| ALS-extracted hollow ways (in km2) | 1570 | 37 | 97.6% | 2.4% |
| AD 1600 route network (in km2) | 44.8 | 18.5 | 70.8% | 29.2% |
| TMK 1850 routes (in km) | 782.2 | 313.2 | 60.0% | 40.0% |
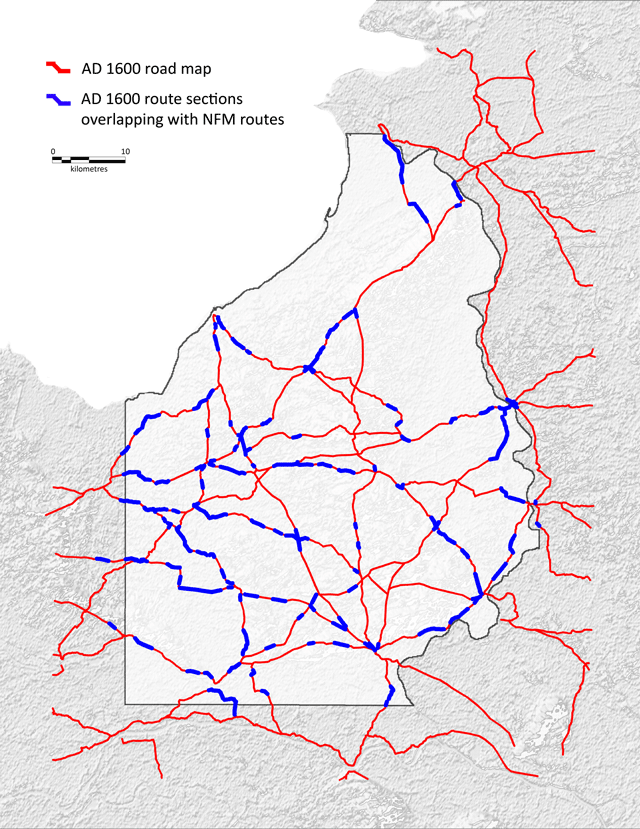
Figure 8
AD 1600 road-map sections overlapping with NFM routes (in blue).
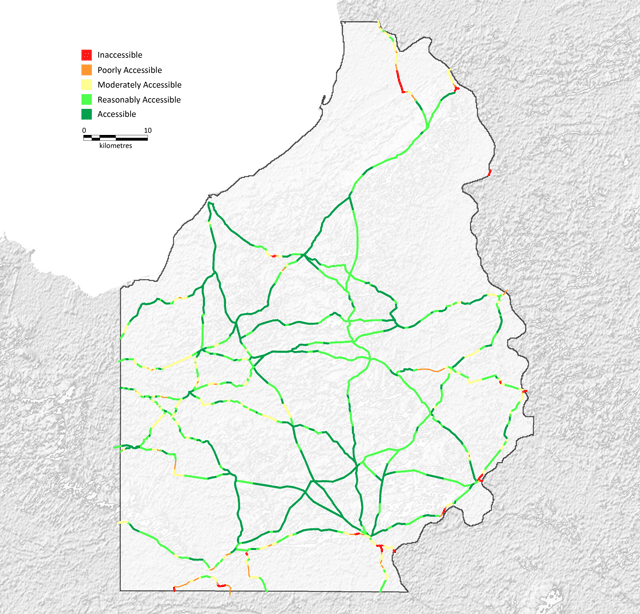
Figure 9
Local-accessibility values integrated in the AD 1600-route network. For each section within the AD 1600 route network local accessibility values based on network friction is given. Green areas depict well-accessible areas, yellow, orange and red poorly accessible regions.
Table 6
Agreement between LCP-calculated routes (100 m wide route zone), the ALS-extracted hollow ways, the AD 1600 route network and the TMK 1850.
| Description | Outside route zone | Inside route zone | % Outside route zones | % Inside route zone |
|---|---|---|---|---|
| ALS-extracted hollow ways (in metres) | 150314 | 11292 | 92.7% | 7.3% |
| AD 1600 route network (in metres) | 147223 | 14383 | 91.1% | 8.9% |
| TMK 1850 routes (in metres) | 108600 | 53006 | 67.2% | 32.8% |
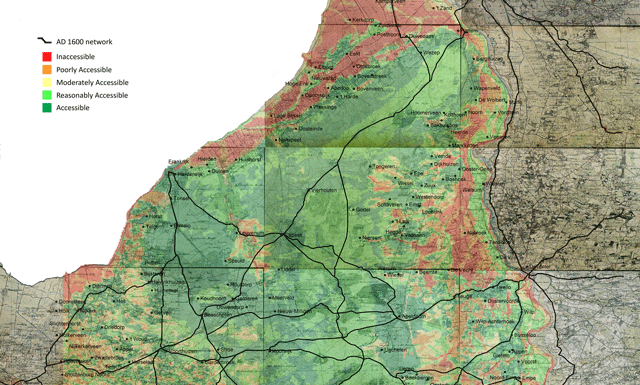
Figure 10
Network-friction map overlaid on the TMK 1850 and the AD 1600 road map by Horsten (2005) for the northwestern part of the study area. In this section, for example, it is clearly visible that not all AD 1600 routes connect settlements, reflecting the fragmentary state of AD 1600 route network. Based on the NFM, movement corridors are reconstructed which can point towards probable missing route-zone connections. For example connecting thoroughfares can be expected running from west to east in the northern part of the study area.