
Figure 1
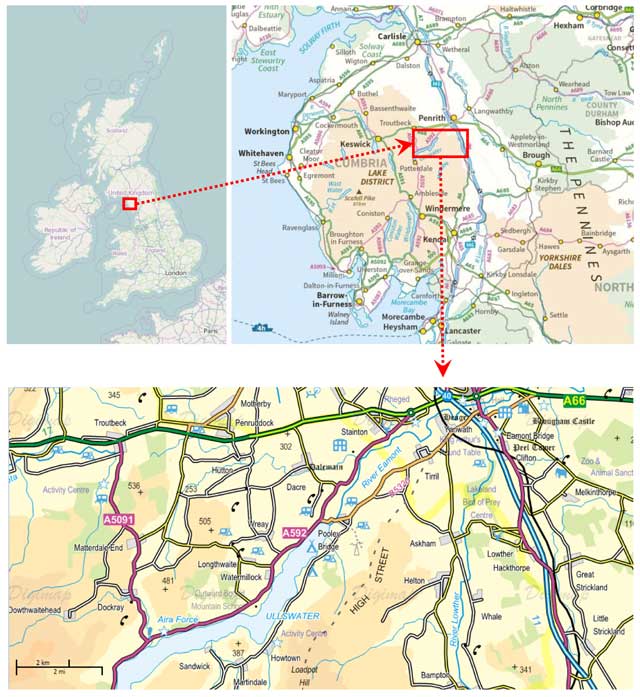
Location of the study area, Askham and Helton parish, Cumbria in the UK; Askham and Helton parish identified by the red border.
Table 1
A preference-based value typology; value preference statement, value basis, and value domain.
| Value preference statement | Underlying value basis | Value domain | |
|---|---|---|---|
| 1 | A landscape that promotes vitality, physical and mental well-being. | Physical & mental health | Socio-cultural |
| 2 | A landscape that maintains local arts, customs, institutions, and characteristics. | Cultural diversity & identity | |
| 3 | Fair and equal access to all aspects of the surrounding landscape | Equity & equal allocation | |
| 4 | A landscape in which scarce and rare elements exist, now and in the future | Scarcity & Rarity | Ecological |
| 5 | A mixed landscape of meadow, mountain, woodland, river, and farmland | Complexity & Diversity | |
| 6 | A landscape that protects and provides long-term stability of the environment | Integrity & Resilience | |
| 7 | A landscape that provides resources for consumption, now and in the future | Sustainable & utilitarian | Economic |
| 8 | A landscape in which resources are produced efficiently and in large quantity | Efficiency & Maximisation | |
| 9 | Landscape that provides resources that can be exchanged for monetary value | Monetary valuation of goods, services & benefits received |
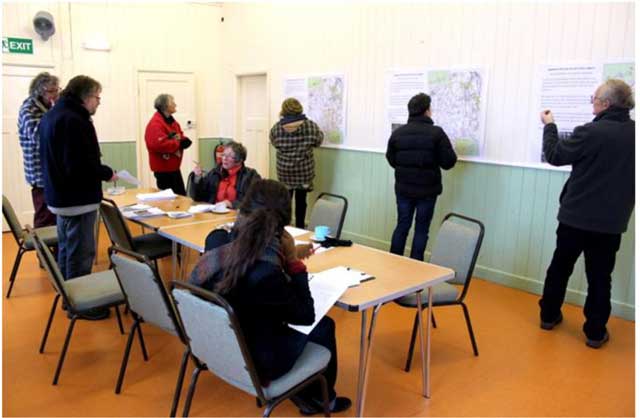
Figure 2
Completion of the questionnaire and map exercise in Askham village hall.
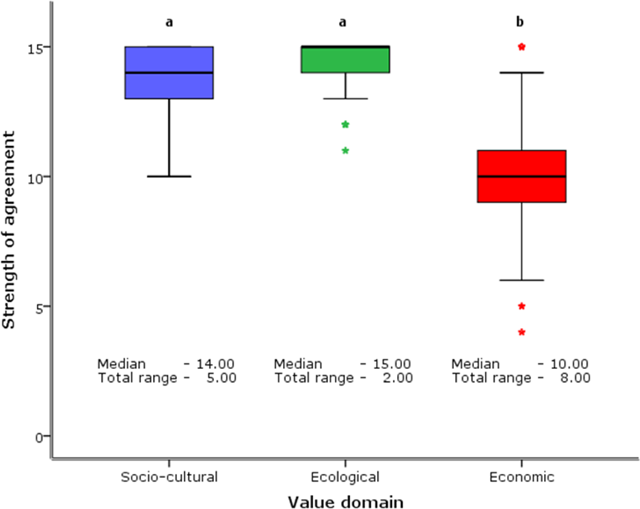
Figure 3
Difference in the strength of agreement between value domains, χ2 = 52.993, df = 2, p < 0.001; agreement scores for the three questions within each value domain are aggregated by respondent prior to analysis; N = 111. Black lines show medians, boxes show interquartile range and whiskers show total range (excluding outliers shown as stars). Letters denote homogenous subsets of value.
Table 2
Proportional data for strength of agreement responses by value domain. Participant responses for individual statement responses have been combined in to two groups, agree and neutral/disagree, for each value domain.
| Value domain | Agree (%) | Neutral/Disagree (%) |
|---|---|---|
| Socio-cultural | 92.8 | 7.2 |
| Ecological | 97.3 | 2.7 |
| Economic | 44.1 | 55.9 |
Table 3
Ranking preference-based value statements by strength of agreement; the sum of ranks is used for ranking purposes, N = 333.
| Rank | Value domain | Value preference statement | Sum of ranks |
|---|---|---|---|
| 1 | Ecological | A mixed landscape of meadow, mountain, woodland, river, and farmland | 8211.41 |
| 2 | Ecological | A landscape that protects and provides long-term stability of the environment | 8081.54 |
| 3 | Socio-cultural | A landscape that promotes vitality, physical and mental well-being | 8020.86 |
| 4 | Ecological | A landscape in which scarce and rare elements exist, now and in the future | 7119.91 |
| 5 | Socio-cultural | Fair and equal access to all aspects of the surrounding landscape | 6828.35 |
| 6 | Socio-cultural | A landscape that maintains local arts, customs, institutions, and characteristics | 6669.62 |
| 7 | Economic | A landscape that provides resources for consumption, now and in the future | 5725.01 |
| 8 | Economic | Landscape that provides resources that can be exchanged for monetary value | 2543.38 |
| 9 | Economic | A landscape in which resources are produced efficiently and in large quantity | 2410.55 |
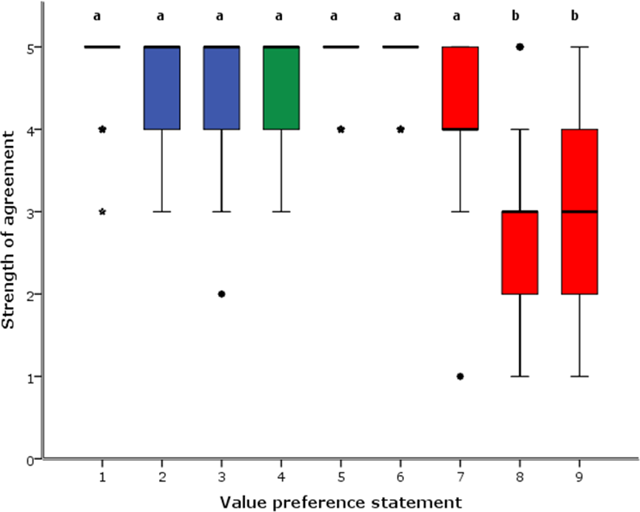
Figure 4
Difference between the strength of participant agreement for the nine preference-based value statements, χ2 = 145.738, df = 8, p < 0.0005; N = 333. Black lines show medians, boxes show interquartile range, and whiskers show total range (excluding outliers shown as stars). Letters denote homogenous subsets by value statement.
Table 4
Proportional data for strength of agreement responses for individual preference-based value preference. Participant responses have been combined in to two groups, agree and neutral/disagree, for each value preference statement.
| Value domain | Underlying value basis | Agree (%) | Neutral/Disagree (%) |
|---|---|---|---|
| Socio-cultural | Physical & mental well-being | 97.3 | 2.7 |
| Cultural diversity & identity | 89.2 | 10.8 | |
| Equity & equal allocation | 91.2 | 8.8 | |
| Ecological | Scarcity & rarity | 91.2 | 8.8 |
| Diversity & complexity | 100.0 | 0.0 | |
| Integrity & resilience | 100.0 | 0.0 | |
| Economic | Sustainable & utilitarian | 83.8 | 16.2 |
| Efficiency & maximisation | 21.6 | 78.4 | |
| Monetary valuation of goods, services & benefits received | 27.0 | 73.0 |
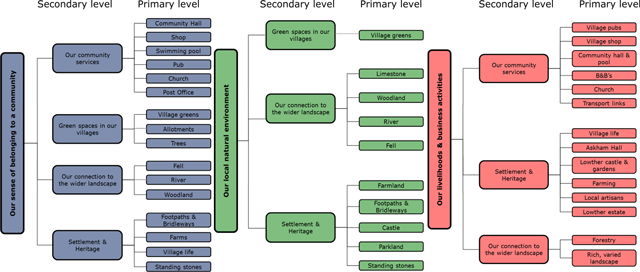
Figure 5
Results of map-based value exercise, participants identified areas of the surrounding landscape, specific areas within it, buildings, or facilities that contribute to a perceived sense of value within each of the three value domains. Within each value domain the identified elements have been grouped thematically, post-hoc.
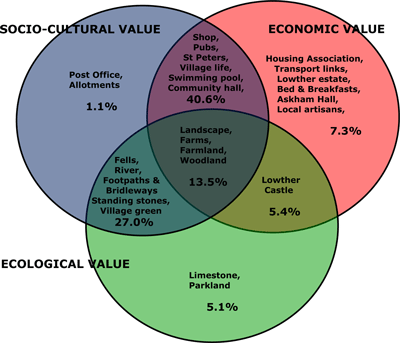
Figure 6
A Venn diagram displays location choices by value domain; intersections represent the connected nature of the community-landscape value relationship. Selections centred on landscape, farms, farmland, and woodland were thought to hold a sense of value within socio-cultural, ecological, and economic value domains. Numbers denote percentage of all selections; 86.5% of locations represent two or more value domains, 13.5% only one value domain.