
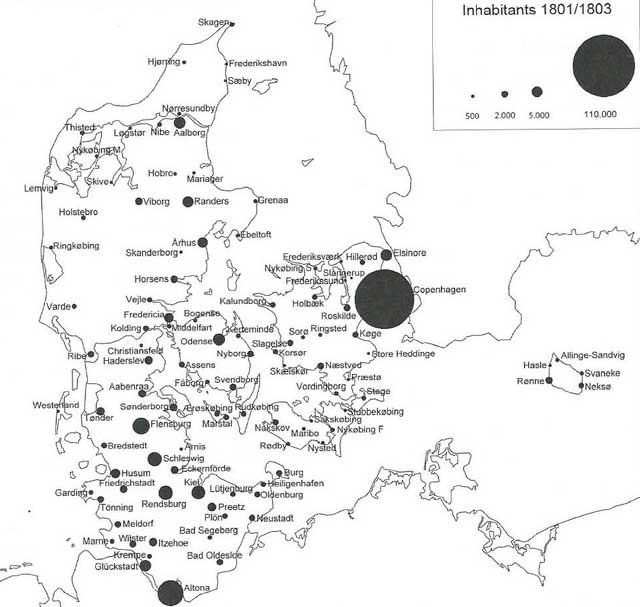
Figure 1
The population figures for towns in the Kingdom of Denmark (1801) and the duchies of Schleswig and Holstein (1803). The frontier between the kingdom and the duchies ran along a river near the towns Ribe and Kolding. (Christensen and Mikkelsen 2008: 20).
Table 1
Urban land in 1861.
| Area in hectares | 0–110 | 111–220 | 221–330 | 331–440 | 441–550 | 551–1100 | More than 1100 |
|---|---|---|---|---|---|---|---|
| Number of towns: Total agricultural area | 2 | 6 | 11 | 11 | 7 | 21 | 9 |
| Number of towns: Area tilled | 7 | 19 | 11 | 9 | 10 | 9 | 2 |
[i] Based on: The Danish National Archives, Danmarks Statistik, Lists concerning area under tillage 1861 + Lists concerning livestock 1861.
Table 2
The tilled area as a percent of total urban land in 1861.
| ‘Cultivation percent’ | 30.1–40% | 40.1–50% | 50.1–60% | 60.1–70% | 70.1–80% | More than 80% |
|---|---|---|---|---|---|---|
| Number of towns | 1 | 14 | 14 | 27 | 9 | 2 |
[i] Based on: The Danish National Archives, Danmarks Statistik, Lists concerning area under tillage 1861 + Lists concerning livestock 1861.
Table 3
The distribution of crops in 1861 (67 sample towns).
| Crop/use | Total area in hectares | Share of the total urban land |
|---|---|---|
| Wheat | 1717 | 4% |
| Rye | 3829 | 9% |
| Barley | 5706 | 14% |
| Oats | 6693 | 16% |
| Clover | 8227 | 20% |
| Mixed crops (grain) | 792 | 2% |
| Potatoes | 896 | 2% |
| Peas, rape, buckwheat, beans etc. | 1115 | 3% |
| Meadows | 2523 | 6% |
| Commons for grazing | 1093 | 3% |
| Plough land, this year used for grazing | 6879 | 17% |
| Fallow (totally) | 2192 | 5% |
| In total | 41,662 | 100% |
[i] Based on: The Danish National Archives, Danmarks Statistik, Lists concerning area under tillage 1861 + Lists concerning livestock 1861.
Table 4
Animals in the towns in 1861.
| Number of animals | Number of towns: | |||
|---|---|---|---|---|
| Cattle (bullocks, cows, young cattle) | Horses | Sheep | Pigs | |
| 0–50 | 0 | 6 | 14 | 10 |
| 51–100 | 3 | 21 | 8 | 13 |
| 101–200 | 19 | 23 | 17 | 19 |
| 201–300 | 14 | 9 | 10 | 13 |
| 301–400 | 10 | 4 | 7 | 9 |
| 401–500 | 5 | 3 | 3 | 1 |
| 501–750 | 12 | 1 | 4 | 1 |
| 751–1000 | 4 | 0 | 2 | 1 |
| More than 1000 | 0 | 0 | 2 | 0 |
[i] Based on: The Danish National Archives, Danmarks Statistik, Lists concerning area under tillage 1861 + Lists concerning livestock 1861.
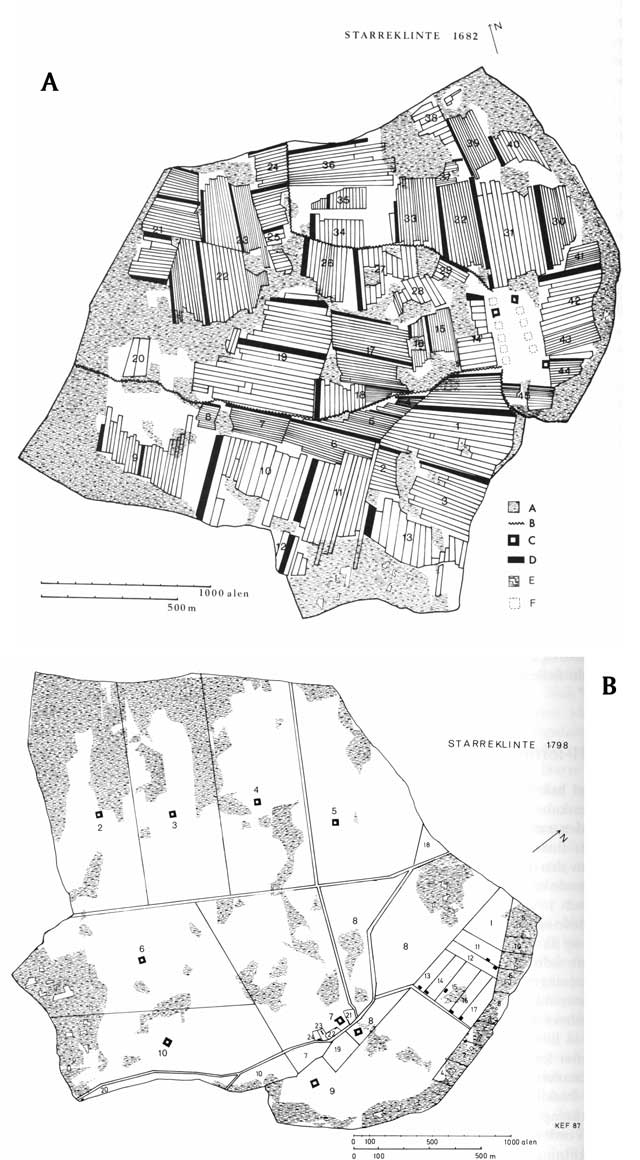
Figure 2
Starreklinte – a typical village in eastern Denmark before and after enclosure. In the drawing of the structure in 1682 the black stripes (D) indicate the fields belonging to a particular farm, while A marks the meadows, B the fences, C and F the certain and probable siting of the farms and E the bog. The 1798 map shows that the farms were now moved with their new concentrated holdings, while some small holdings were established on the place where the village had been until then. Drawing by Karl-Erik Frandsen. (Dombernowsky 1988: 72, 322).
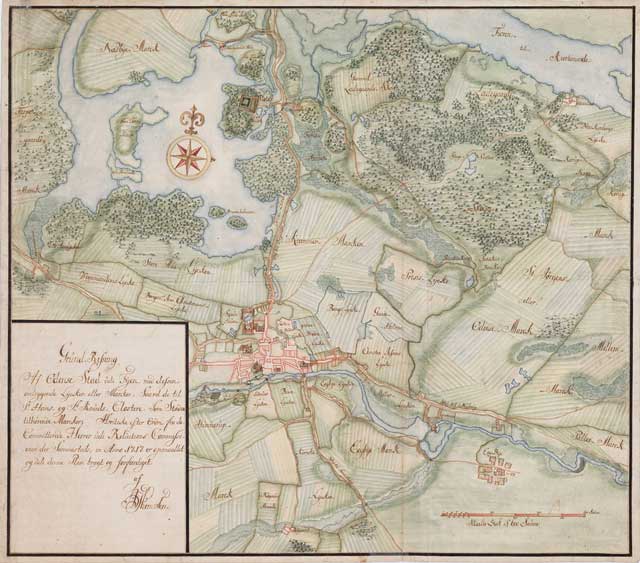
Figure 3
Odense on a map from 1717, when the city had approx. 5,000 inhabitants. Odense was surrounded by several fields, each with a certain name. ‘The enclosure of the carters’ was undoubtedly used for grazing the cart horses. In total about 300-400 cows and approx. 100 horses grazed on the meadows and fields in the Summer. (The National Archives, Ingeniørkorpset, Feignets kortsamling, box 1).
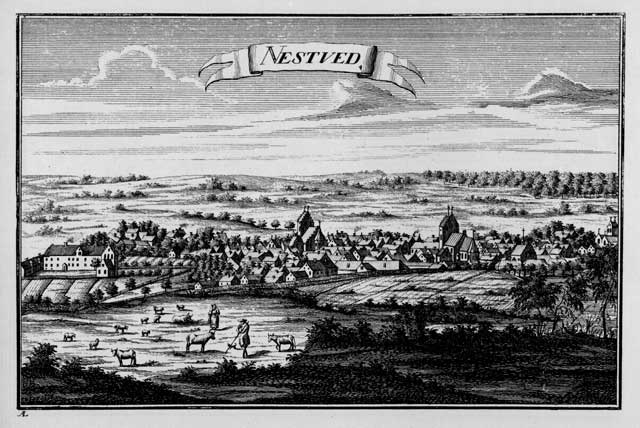
Figure 4
Næstved and Herlufsholm (to the left) on a drawing from the 1760s. As many other Danish towns, at that time, Næstved had between 1500 and 2000 inhabitants. (Pontoppidan 1767: 93).
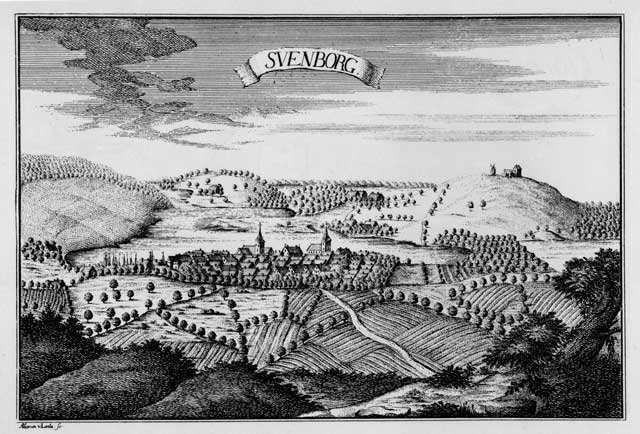
Figure 5
Svendborg, drawing from the 1760s. (Pontoppidan 1767: 531).
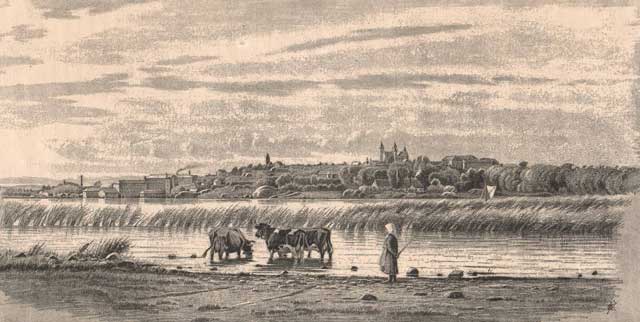
Figure 6
The lake on the outskirts of Viborg was in former times an important watering place for farm animals, as is indicated in this drawing by Hans Smith, c.1850. (The museum of the diocese of Viborg).
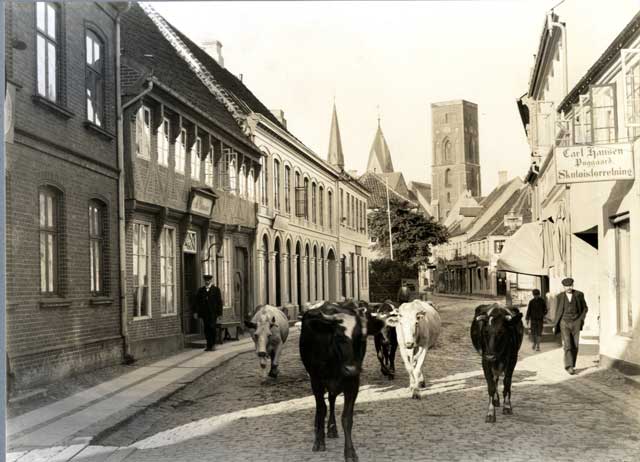
Figure 7
Cows walking through the main streets of Ribe, c. 1910. Presumably they were on their way between the meadows and the stables, where they were milked. (The city archives of Ribe).