
Table 1
Predictive variables used in the case-study in Heerde.
| Analysis | Independent variable | Data Format | Description | Literature |
|---|---|---|---|---|
| ANOVA | Agricultural occupation | Categorical | Classification in hobby, part-time and full-time farmers | Kristensen, 1999; Munton et al., 1989; Schmitzberger et al., 2005 |
| Multiple regression analysis | Scale enlargement | Binary | Farm size increase of 15% or more in the past 10 years | Levin et al., 2006; Geertsema, 2002 |
| Average Parcel size | In hectares | Average size of parcels managed by farmer | Levin, 2006; Petit & Firbank, 2006 | |
| Farm size | In hectares | Sum of all registered agricultural parcels | Levin, 2006; Lovell et al., 2010; Seabrook et al., 2008 | |
| Livestock Density | LSU/ha. | Aggregate value for inter-farm livestock density comparison | Sullivan et al., 2011 | |
| Share Arable Land | Percentage | Percentage of agricultural land in use for arable crops and/or grassland in rotation in relation to permanent grassland | Baudry et al., 2000 | |
| Agricultural Income | Percentage | Share of income derived from agricultural production | Renting et al., 2008; Walford, 2005 | |
| In-migration | Binary | Farmers’ residential background; migrated to current farm stay from other urban, town or rural destination? | Paquette & Domon, 2003; Madsen et al., 2005 | |
| Age | Years | Age of farmer (and partner if applicable) | Kristensen et al., 2004; Schmitzberger et al., 2005 | |
| Succession | Binary | Farm long-term future; is succession planned? | Potter & Lobley, 1992 | |
| Education | Binary | Did respondent or partner receive an agricultural education? | Seabrook et al., 2008; Schmitzberger et al., 2005 | |
| Attitude | Likert-scale (1–3) | Does agricultural land user feel a strong responsibility as a farmer for the landscape/nature? | Busck, 2002; Schmitzberger et al., 2005 |
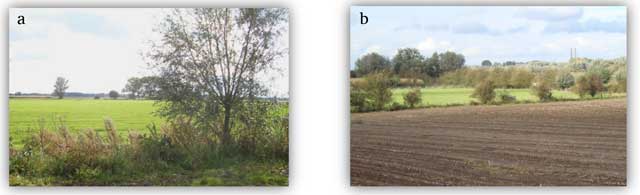
Figure 1
Impression of landscape elements in the case-study area.
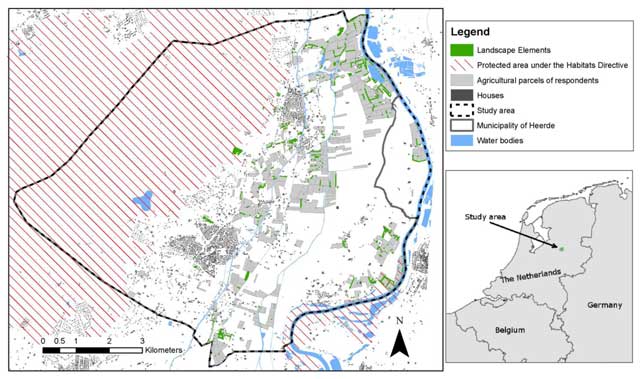
Figure 2
The distribution of landscape elements on agricultural parcels of respondents.
Table 2
An overview of total share of semi-natural landscape elements on agricultural parcels managed by hobby. part-time and full-time farmers and one-way analysis of variance.
| Farmer type (N=44) | Share of respondents | Agricultural income/total income (Avg.) | Share of landscape elements (Avg.) | One-Way ANOVA | Boxplot | |
|---|---|---|---|---|---|---|
| F | Sig. | 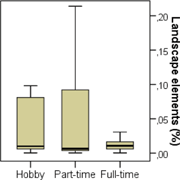 | ||||
| Hobby | 40.9 % | 1.7 % | 10.51 % | 0.848 | 0.436 | |
| Part-time | 25.0 % | 17.5 % | 9.29 % | |||
| Full-time | 34.1 % | 88.7 % | 1.24 % | |||
| R-square = 0.040 | ||||||
Table 3
The final multiple linear regression model selected through hierarchical regression analysis based on AIC selecting seven relevant farm management characteristics as predictors for the relative share of semi-natural landscape elements on agricultural parcels and direct field margins (criterion).
| Model results | Dependent variable = | Relative share of canopy coverage by landscape elements in relation to the total surface of agricultural parcels | ||||||
|---|---|---|---|---|---|---|---|---|
| N = 44 | R | R² | Adj. R² | F | Sig | |||
| 0.699 | 0.489 | 0.381 | 4.511 | 0.001 | ||||
| Independent variables | b | ß | t | Sig. | Zero-order | Tol. | VIF | Relative weights |
| Farm size | 0.023 | 0.379 | 1.860 | 0.072 | –0.076 | 0.37 | 2.68 | 4.3% |
| Education | 0.842 | 0.219 | 1.599 | 0.119 | 0.025 | 0.82 | 1.22 | 5.8% |
| Scale enlargement | –1.547 | –0.403 | –2.608 | 0.014 | –0.161 | 0.66 | 1.54 | 6.9% |
| Share arable land | –1.787 | –0.219 | –1.614 | 0.116 | –0.350 | 0.84 | 1.18 | 16.4% |
| Average parcel size | –1.066 | –0.509 | –2.722 | 0.010 | –0.395 | 0.44 | 2.26 | 23.4% |
| Attitude | 0.515 | 0.196 | 1.545 | 0.132 | 0.243 | 0.96 | 1.04 | 10.6% |
| In-migration | 1.199 | 0.317 | 2.279 | 0.029 | 0.386 | 0.80 | 1.25 | 32.6% |
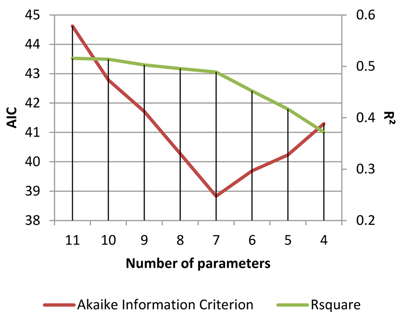
Figure 3
The hierarchical linear regression model selection process based on AIC. Rsquare depicted of the right Y-axis for reference.