
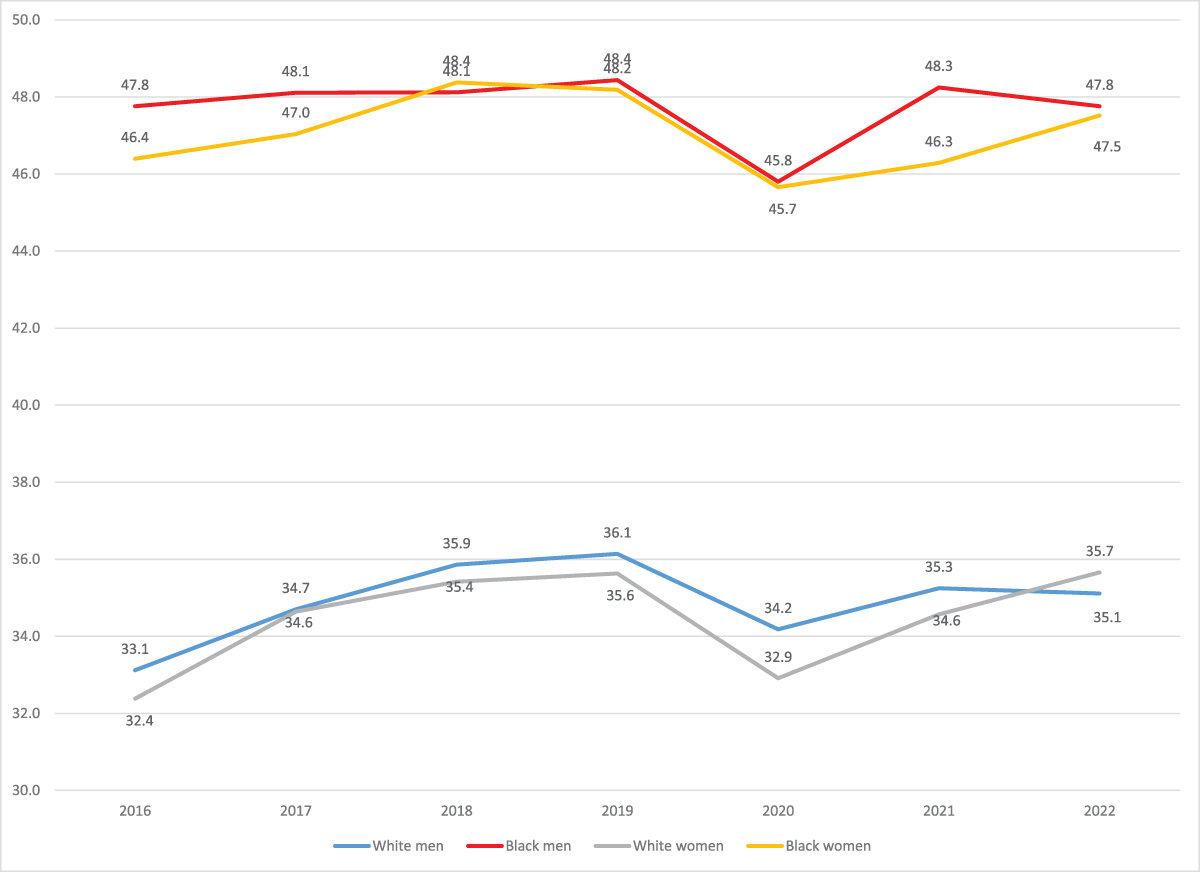
Graph 1
Informal employment rate of the occupied population aged 16 years or older by race/skin-color and gender (%) – Brazil, 2016 to 2022.
Source: IPEA 2024.
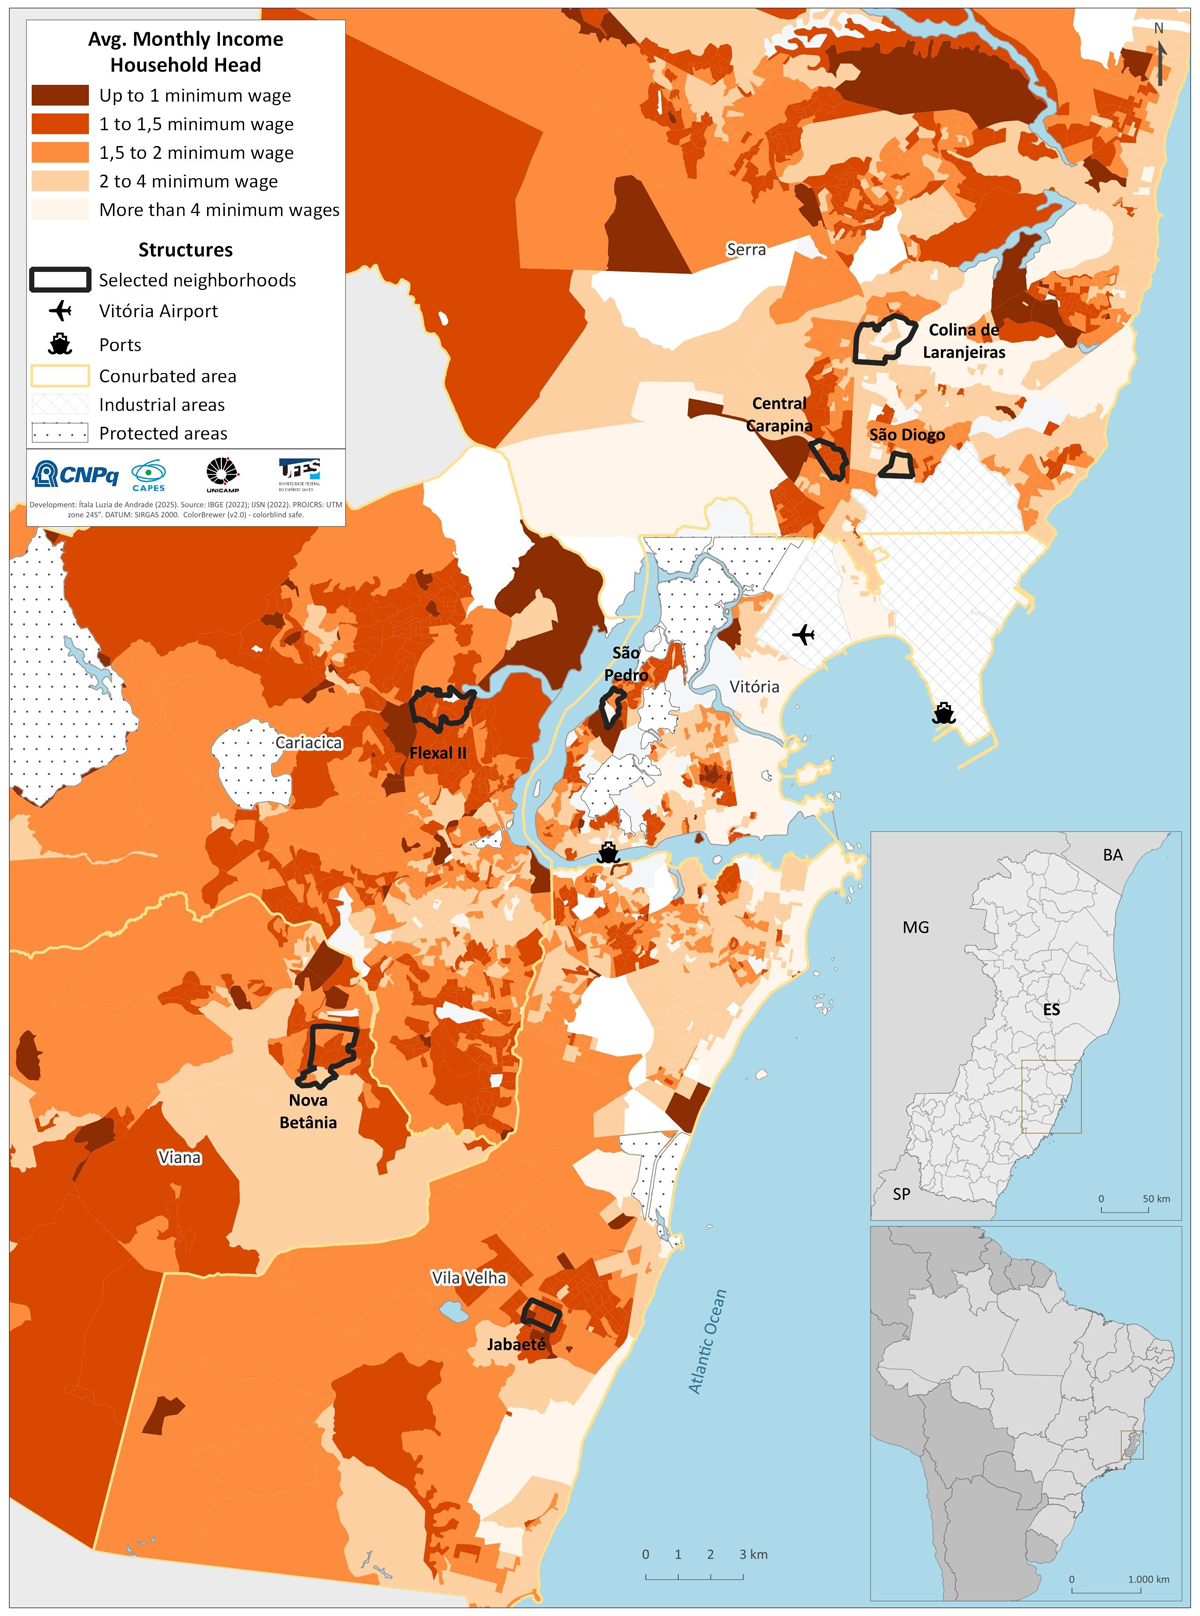
Figure 1
Distribution of census tracts according to individual average income sextiles and neighborhoods selected for the household survey, 2022.
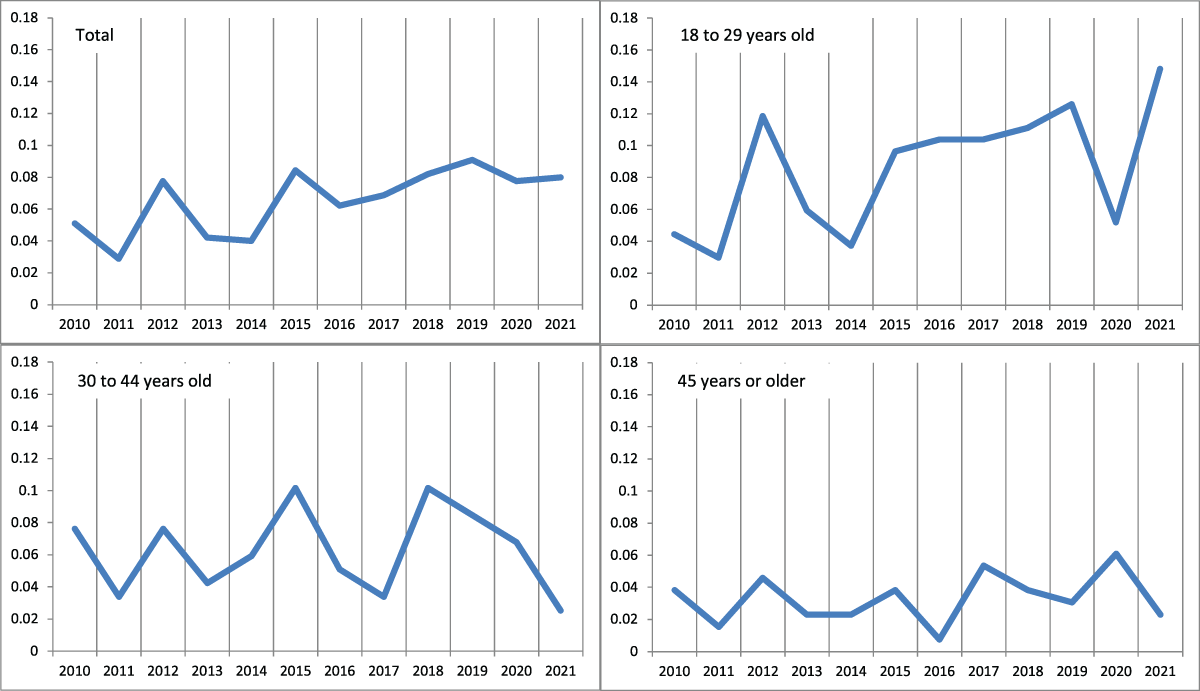
Figure 2
Intensity of residential mobility according to the age group of the head of household in 2010. Metropolitan Area of Vitória, 2022.
Source: MigraFamília, 2022.
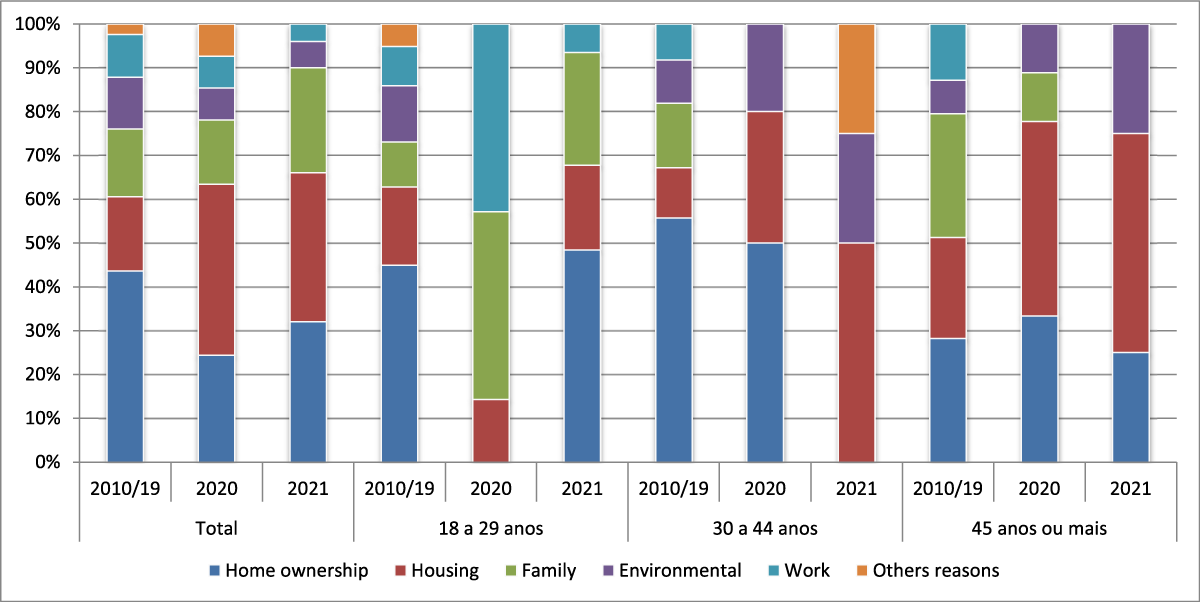
Figure 3
Motivation for residential mobility according to the head of household’s age group in 2010. Metropolitan Area of Vitória, 2022.
Source: MigraFamília, 2022.
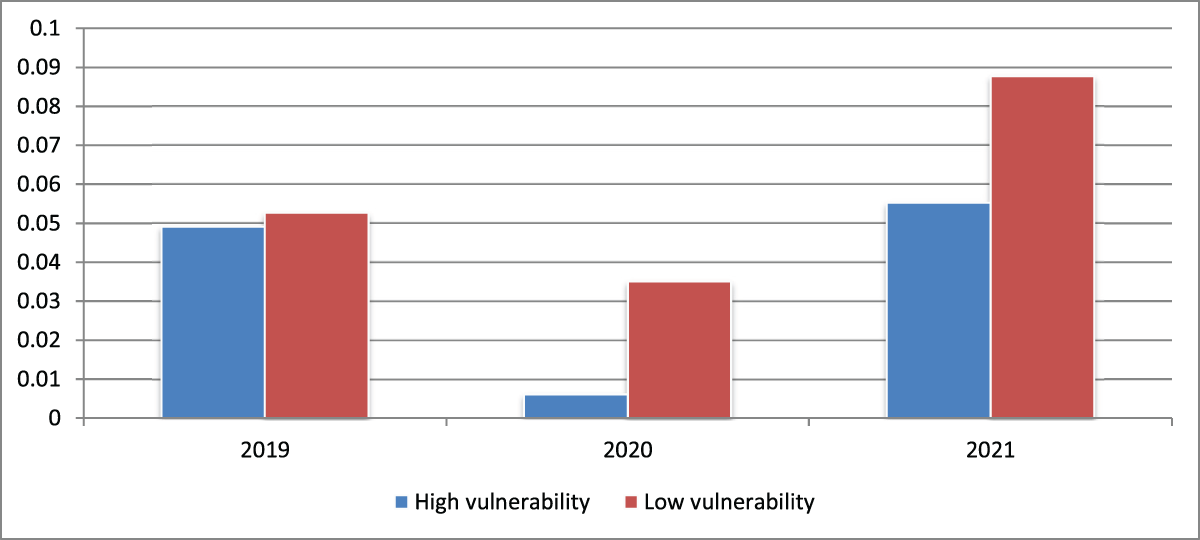
Figure 4
Intensity of residential mobility for head of household aged from 18 to 34 years according to vulnerability. Metropolitan Area of Vitória, 2022.
Source: MigraFamília, 2022.
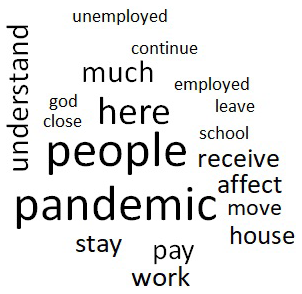
Figure 5
Cloud map by similarity: frequency of expressions in the interviews about the impact of the pandemic.
Source: MigraFamília, 2023.
Table 1
Impact of the Pandemic – Most frequent expressions in interviews in order of relationship.
| MAIN CATEGORIES | PANDEMIC | PEOPLE | HERE | MUCH (MINOR DIMENSION) |
|---|---|---|---|---|
| Associated terms | To understand | To understand | God | God |
| To move | To affect | Close | Unemployed | |
| To stay | To receive | To understand (between God and close) | To continue (between unemployed and employed) | |
| To pay | School | Much | Here | |
| House | Close | Employed | ||
| To work (between to stay and to pay) | Here | To leave | ||
| School |
[i] Source: MigraFamília, 2023.
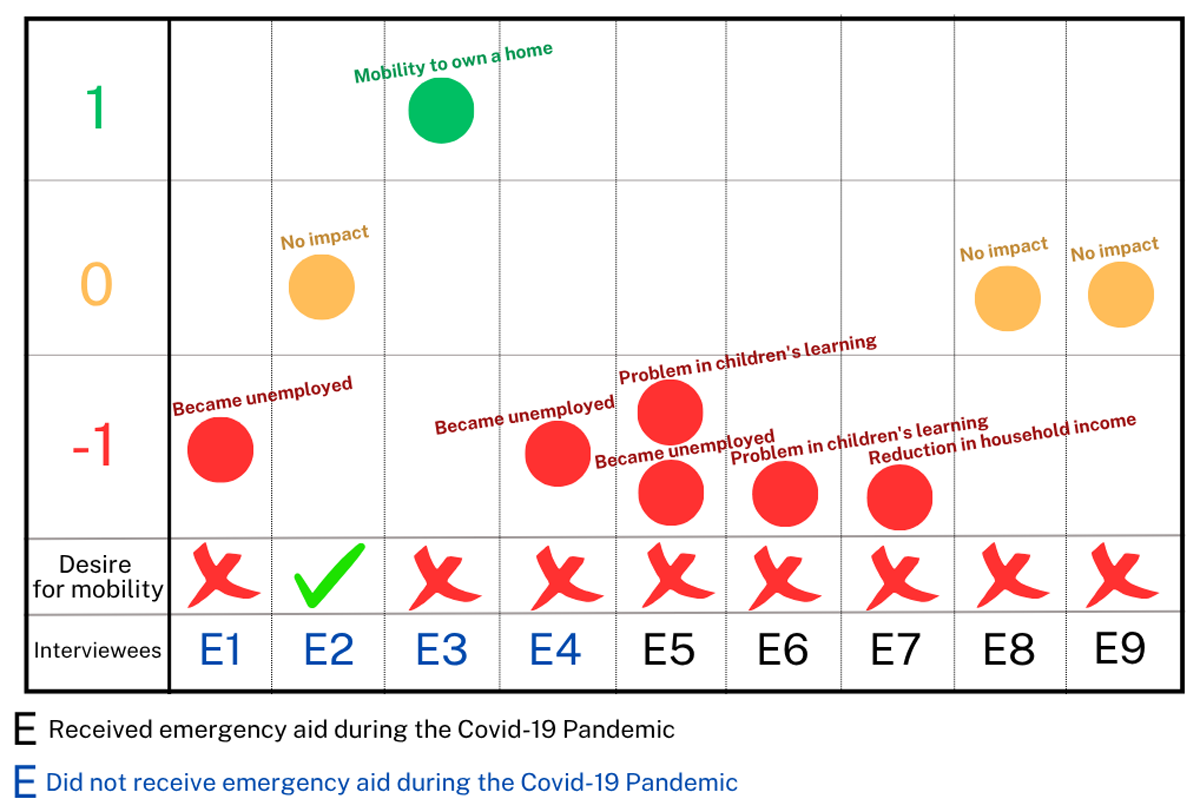
Figure 6
Relationship between the interviewees and the impacts on mobility during the COVID-19 Pandemic.
Source: MigraFamília, 2023.