
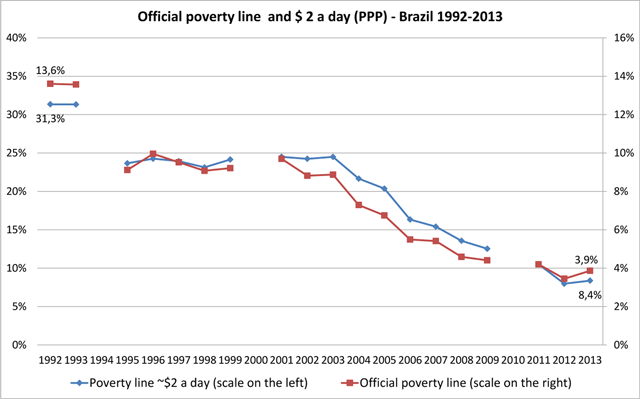
Figure 1
Extreme poverty according to different monetary poverty lines – Brazil, 1992–2013.
Source: Own calculations, based on data from the National Household Survey – PNAD/IBGE, several years.
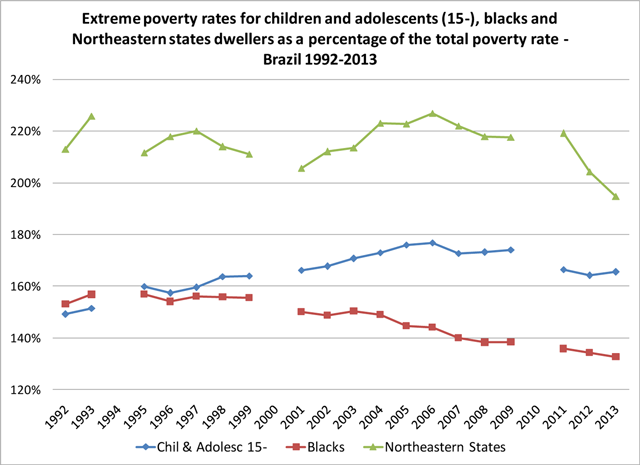
Figure 2
Extreme poverty for specific groups as a percentage of the total poverty rate – Brazil, 1992–2013.
Source: Own calculations, based on data from the National Household Survey – PNAD/IBGE, several years.
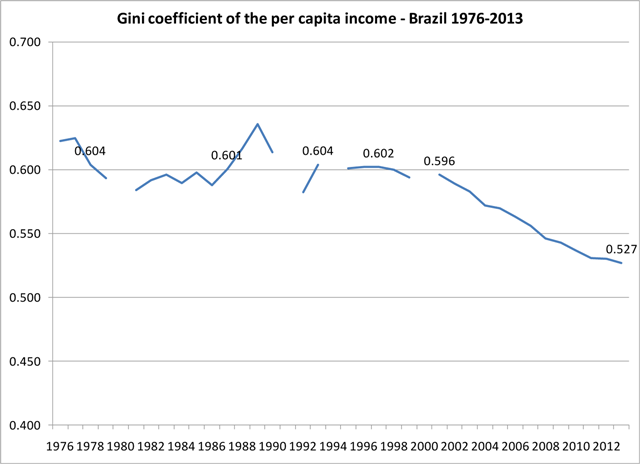
Figure 3
Gini Coefficient of per capita income – Brazil, 1976–2013.
Source: Institute for Applied Economic Research – IPEA, based on data from the National Household Survey – PNAD/IBGE, several years.
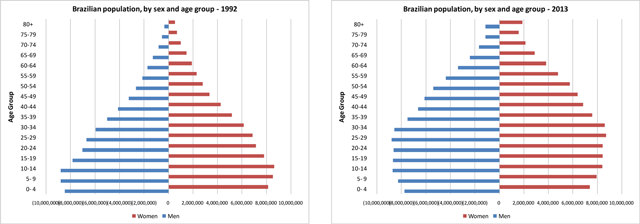
Figure 4
Population by sex and age group – Brazil, 1992 and 2013.
Source: Brazilian Institute of Geography and Statistics – IBGE.
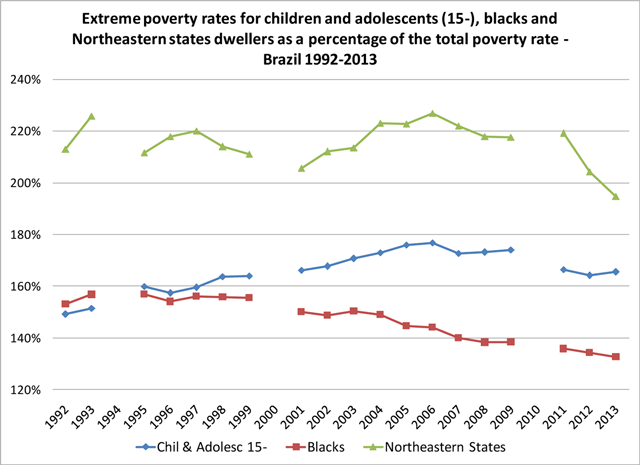
Figure 5
Average number of children (aged up to 15) and of those aged from 16 in the 20 percent poorest households Brazil, 1992–2013.
Source: Own calculations, based on data from the National Household Survey – PNAD/IBGE, several years.
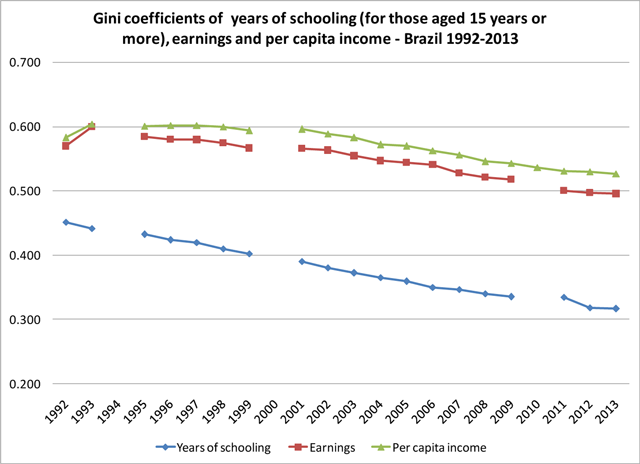
Figure 6
Gini Coefficient of years of schooling (for those aged 15 or more), of earnings and of per capita income – Brazil, 1992–2013.
Source: Institute for Applied Economic Research – IPEA, based on data from the National Household Survey – PNAD/IBGE, several years.
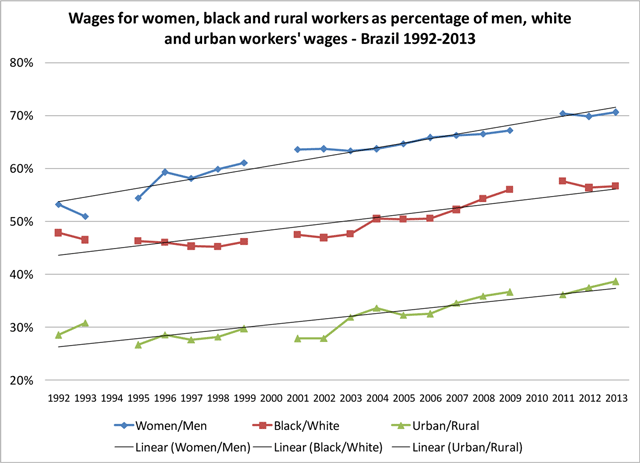
Figure 7
Women, black and rural workers’ average wages as percentage of men, white and urban workers’ average wages – Brazil, 1992–2013.
Source: Own calculations, based on data from the National Household Survey – PNAD/IBGE, several years.
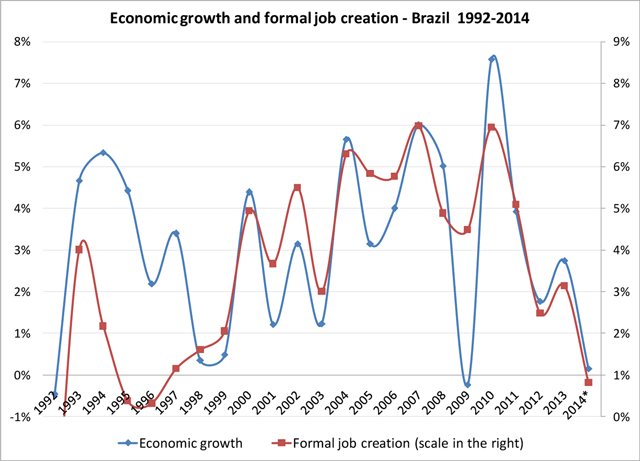
Figure 8
Economic growth and registered job creation, annual rates – Brazil, 1992–2014.
Source: National Accounts – Brazilian Institute of Geography and Statistics; Annual Record of Social Information – RAIS/Ministry of Labour, several years.
*Data of job creation in 2014 based on the General Register of the Employed and Unemployed – CAGED/Ministry of Labour.
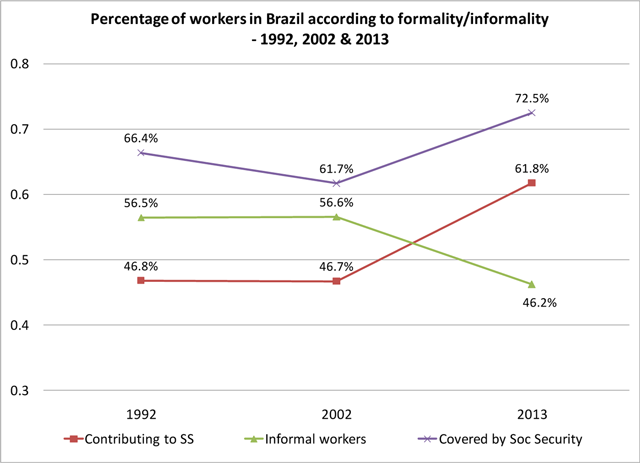
Figure 9
Percentage of workers in Brazil according to social protection status – Brazil, 1992, 2002 and 2013.
Source: Own calculations, based on data from the National Household Survey – PNAD/IBGE, 1992, 2002 and 2013.
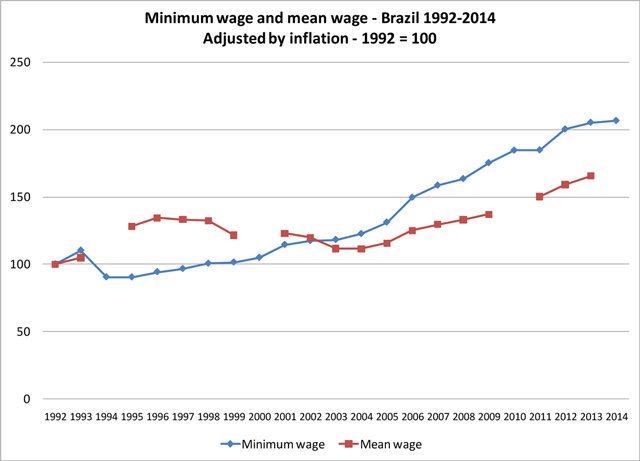
Figure 10
The minimum wage and the mean wage (1992 = 100) between 1992 and 2014.
Source: Own calculations, based on data from the Ministry of Labour (minimum wage) and the National Household Survey – PNAD/IBGE (mean wage), several years. Values adjusted by the National Consumer Prices Index (INPC).
Table 1
Social Protection Expenditures as a percentage of GDP – Brazil 2013.
| in R$ billion | % of GDP | |
|---|---|---|
| Soc. Security benefits – civil servants (A) | 209.5 | 4.3% |
| Soc. Security benefits – private sector (B) | 357.0 | 7.4% |
| Unemployment Insurance (C) | 31.3 | 0.6% |
| Abono Salarial (D) | 13.5 | 0.3% |
| Social Assistance Benefits (E) | 31.8 | 0.7% |
| Bolsa Familia (F) | 24.0 | 0.5% |
| Total (A+B+C+D+E+F) | 667.1 | 13.8% |
| Social Security benefits (A+B) | 566.5 | 11.7% |
| Passive employment policies (C+D) | 44.8 | 0.9% |
| Social Security and Employment policies (A+B+C+D) | 611.3 | 12.6% |
| Social Assistance (E+F) | 55.8 | 1.2% |
| GDP | 4,844.8 | 100% |
[i] Sources: Brazil/Ministry of Planning and the Brazilian Institute of Geography and Statistics/IBGE.