
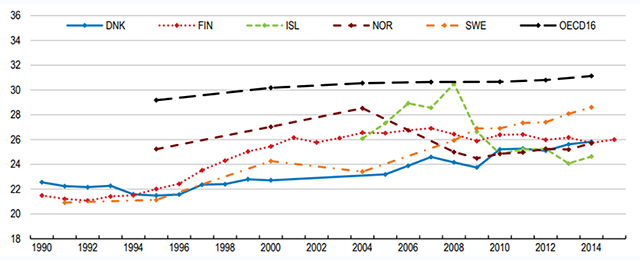
Figure 1
Gini coefficients disposable household income, OECD average and Nordic countries, 1990–2014.
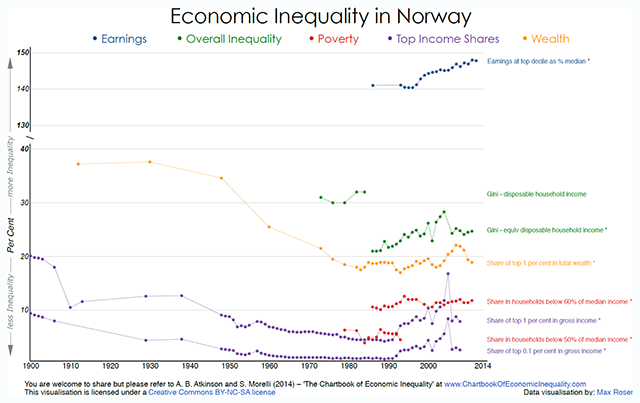
Figure 2
Economic inequality in Norway.
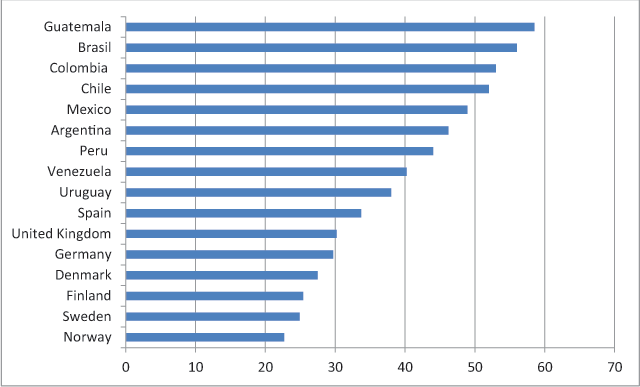
Figure 3
Gini coefficients, disposable household income, Scandinavia and selected Latin American countries (2013).
Table 1
Real GDP per capita, US $ in 1996 Constant Prices (Laspeyres).
| Country | Year | Real GDP per capita |
|---|---|---|
| Honduras | 2000 | 2054 |
| Bolivia | 2000 | 2721 |
| Ecuador | 2000 | 3467 |
| Guatemala | 2000 | 3913 |
| Norway | 1935 | 4081 |
| El Salvador | 2000 | 4434 |
| Peru | 2000 | 4582 |
| Paraguay | 2000 | 4682 |
| Colombia | 2000 | 5380 |
| Costa Rica | 2000 | 5863 |
| Panama | 2000 | 6066 |
| Venezuela | 2000 | 6420 |
| Brazil | 2000 | 7185 |
| Mexico | 2000 | 8766 |
| Uruguay | 2000 | 9612 |
| Chile | 2000 | 9919 |
| Argentina | 2000 | 10994 |
| Norway | 2000 | 27044 |
[i] Sources: Heston et al. (2002), Moene and Wallerstein (2003).
Table 2
Employment Norway 2016.
| Employed | Registered unemployed | Outside of the labor force | Students | |
|---|---|---|---|---|
| Men | 82.9 | 1.1 | 14.9 | 1.1 |
| Women | 77.9 | 0.9 | 19.8 | 1.6 |
[i] Source: Own elaboration based on numbers from Statistics of Norway.
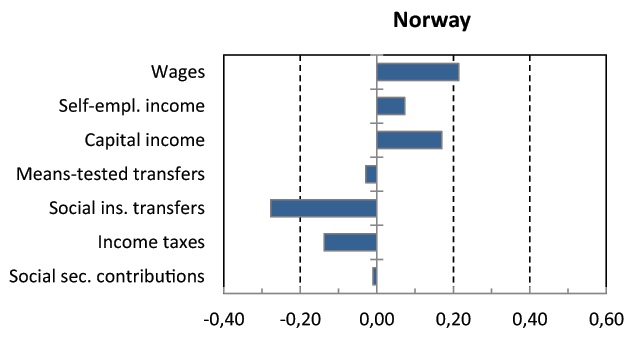
Figure 4
Redistributive effects on Gini coefficient of marginal changes in different components of individual income.
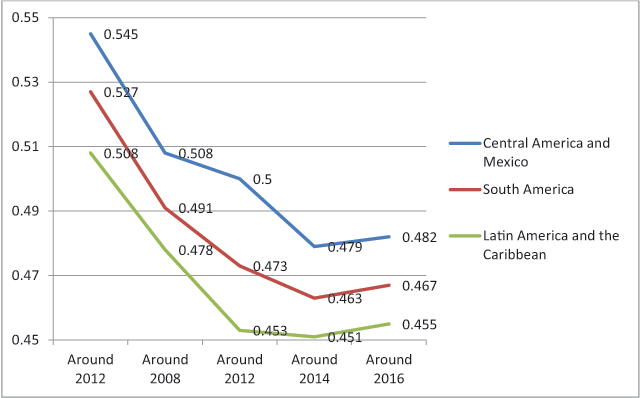
Figure 5
Latin America and the Caribbean (15 countries): average inequality, Gini coefficient of per capita family income, 2002–2016.

Figure 6
Ratio of hourly wages of high education to low education workers.

Figure 7
Unionization rates, selected countries Latin America and Scandinavia.