
Table 1
Levels of GDP per capita in selected countries, 1870 and 1910 (1990 Geary–Khamis dollars).
| Year | United Kingdom | France | United States | Mexico | Latin American average* |
|---|---|---|---|---|---|
| 1870 | 3190 | 1876 | 2445 | 674 | 778 |
| 1910 | 4611 | 2965 | 4964 | 1694 | 1038 |
| Increase in GDP (%) | 45 | 58 | 103 | 150 | 33 |
[i] Source: Based on data from Maddison (2007) updated by Bolt and van Zanden (2014).
*Average of GDP per capita levels of eight Latin American countries: Argentina, Brazil, Colombia, Chile, Mexico, Peru, Uruguay, and Venezuela.
Table 2
Sectoral shares of real GDP per capita, 1877–1910 (Percentages).
| Sectors | 1877 | 1895 | 1910 |
|---|---|---|---|
| Agriculture and livestock | 42.2 | 38.2 | 33.7 |
| Mining | 10.4 | 6.3 | 8.4 |
| Manufacturing | 16.2 | 12.8 | 14.9 |
| Construction | 0.6 | 0.6 | 0.9 |
| Transportation | 2.5 | 3.3 | 2.7 |
| Commerce | 16.9 | 16.8 | 19.3 |
| Government | 11.2 | 8.9 | 7.2 |
| Other | – | 13.1 | 12.9 |
| Total | 100 | 100 | 100 |
[i] Note: Shares based on GDP per capita in prices of 1900.
Source: Coatsworth (1990).
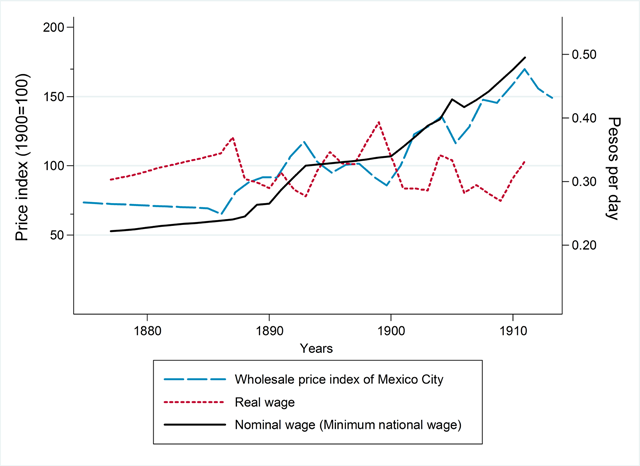
Figure 1
Evolution of prices, nominal wages, and real wages in Mexico, 1877–1911.
Source: See details in appendix.
Table 3
National wage growth and inflation, 1877–1910.
| Average growth of national nominal wages (%) | Average growth of national real wages (%) | Inflation (% change in logarithm of wholesale price index) | |
|---|---|---|---|
| 1877–1899 | 1.89 | 0.77 | 0.72 |
| 1900–1910 | 3.51 | –0.85 | 6.02 |
| 1877–1910 | 2.52 | 0.58 | 2.91 |
[i] Source: See text and appendix.
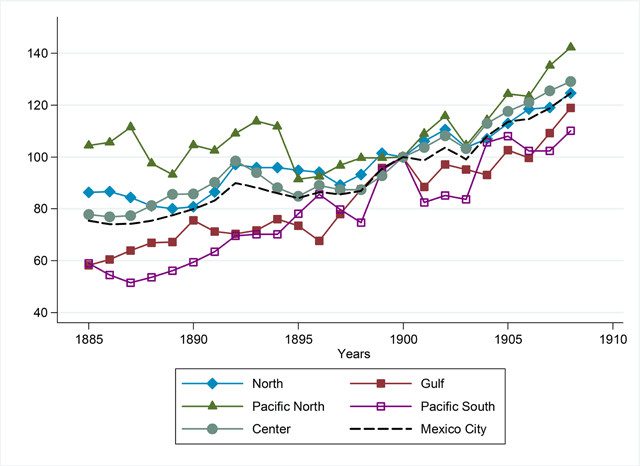
Figure 2
Price index by region (1900 = 100).
Source: Based on prices from Estadísticas and household expenditure weights from Gómez-Galvarriato and Musacchio (2000). See methods in appendix.
Note: Mexico City refers to the wholesale price index of Mexico City.
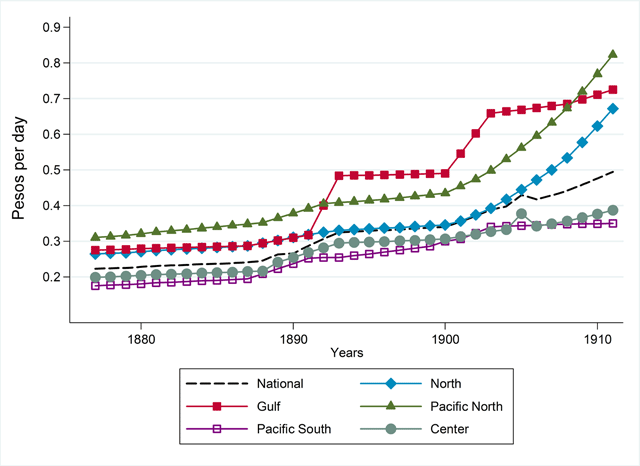
Figure 3
Mexican nominal wages, 1877–1911.
Source: Estadísticas Económicas del Porfiriato, El Colegio de México, 1965.
Table 4
Growth of nominal wages by sector (Average annual growth rates).
| 1877–1889 | 1889–1900 | 1900–1910 | Full period | |
|---|---|---|---|---|
| Agriculture | 0.92 | 2.11 | 2.68 | 1.97 |
| Industry | 3.03 | 1.69 | 3.54 | 2.99 |
| Mining | 2.40 | 2.91 | 8.16 | 4.72 |
[i] Source: See text and appendix.
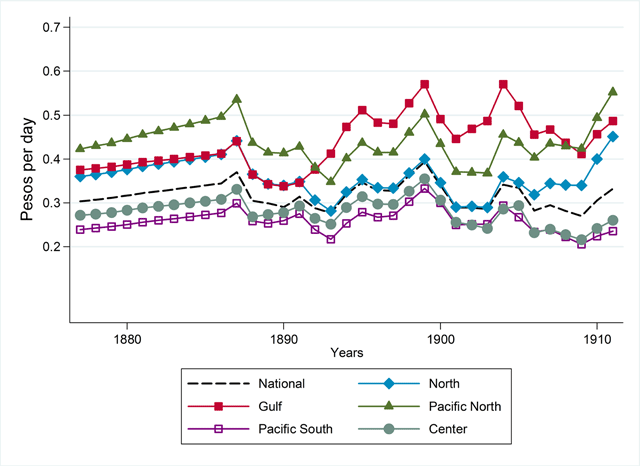
Figure 4
Wages by region adjusted with prices of Mexico City, 1877–1910.
Note: Adjusted with wholesale price index of Mexico City.
Source: See text and appendix.
Table 5
Growth of wages by sector adjusted with prices of Mexico City (Average annual growth rates).
| 1877–1889 | 1889–1900 | 1900–1910 | |
|---|---|---|---|
| Agriculture | –0.26 | 0.30 | –0.23 |
| Industry | 2.01 | 0.57 | –1.12 |
| Mining | 1.29 | 1.84 | 3.88 |
[i] Note: Adjusted with wholesale price index of Mexico City.
Source: See text.
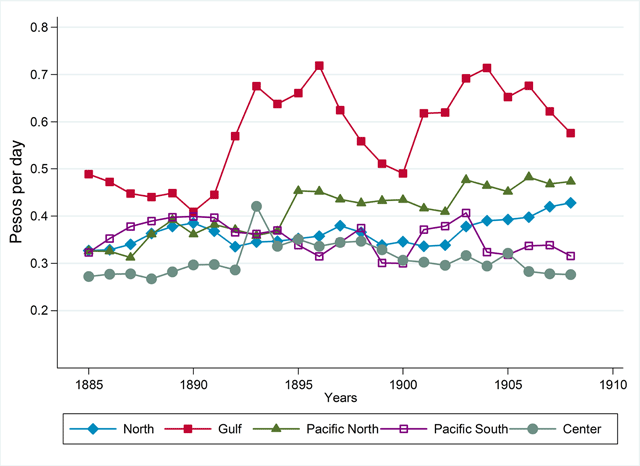
Figure 5
Regional wages adjusted with regional deflators, 1885–1908.
Note: Adjusted with consumer price indices from their corresponding region.
Source: See text and appendix.
Table 6
Growth of regionally-adjusted wages by sector and region (Average annual growth rates).
| North | Gulf | Pacific-North | Pacific-South | Center | |
|---|---|---|---|---|---|
| 1885–1900 | |||||
| Agriculture | 1.52 | 0.25 | 1.26 | –0.12 | 1.04 |
| Industry | 1.49 | –1.13 | 3.34 | –1.94 | 0.35 |
| Mining | 2.06 | –0.93 | 3.17 | –0.34 | 1.53 |
| 1900–1908 | |||||
| Agriculture | 0.20 | 2.21 | 0.77 | 2.36 | –1.47 |
| Industry | 2.01 | 0.10 | 1.23 | –0.24 | –1.52 |
| Mining | 6.08 | –1.32 | 5.57 | 4.79 | 3.53 |
[i] Note: Adjusted with regional deflators (1900 = 100).
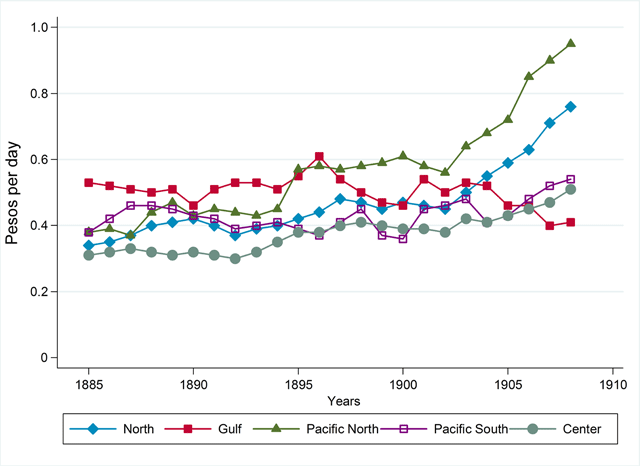
Figure 6
Regionally-adjusted wages in the mining sector, 1885–1908.
Note: Adjusted with consumer price indices (1900 = 100) from their corresponding region.
Table 7
Growth of real wages in industry by region adjusted with regional deflators, 1885–1908 (Average annual growth rates).
| 1885–1900 | 1900–1908 | |
|---|---|---|
| North | 1.49 | 2.01 |
| Pacific-North | 3.34 | 1.24 |
| Gulf | –1.13 | 0.10 |
| Pacific-South | –1.94 | –0.24 |
| Center | 0.35 | –1.52 |
[i] Source: See text.
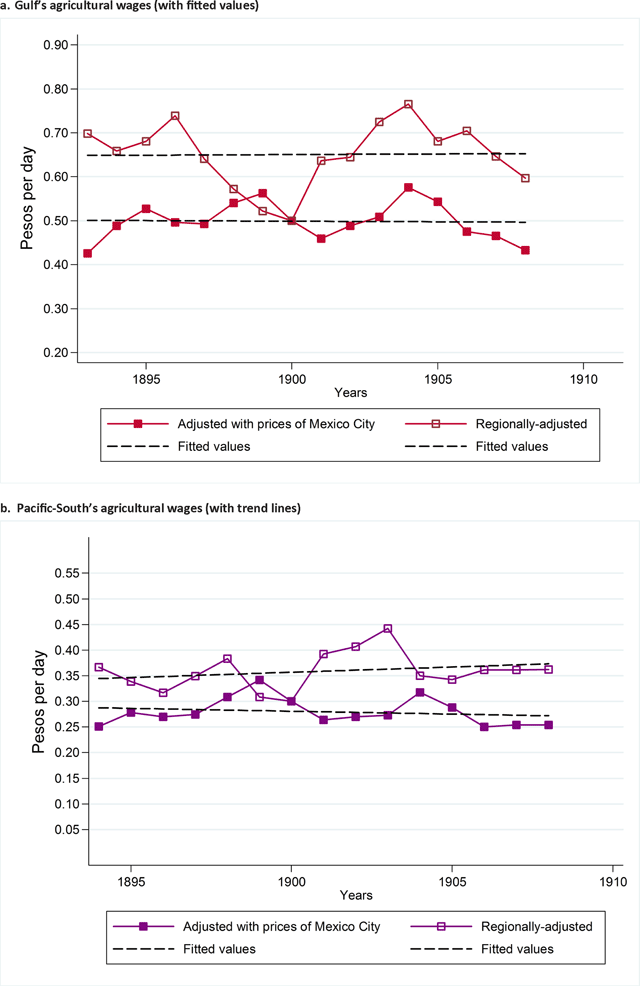
Figure 7
Real wages of the agricultural sector in the Gulf and Pacific-South, 1895–1908.
Source: See appendix.
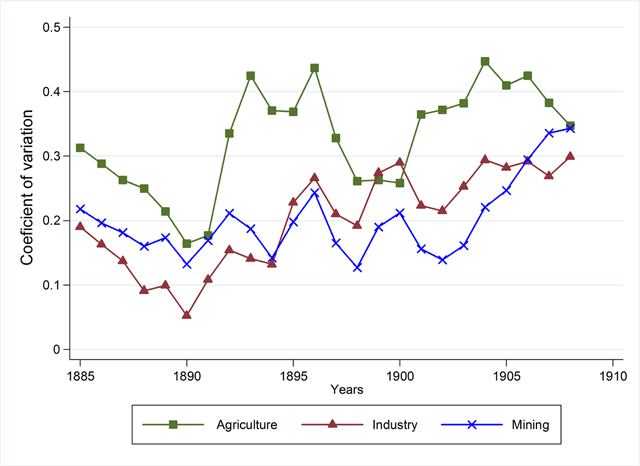
Figure 8
σ-convergence/divergence of real regional wages, 1885–1908.
Note: σ-convergence/divergence is measured as the coefficient of variation of wages adjusted with regional prices among the five regions within a sector for each year.
Source: See in text.
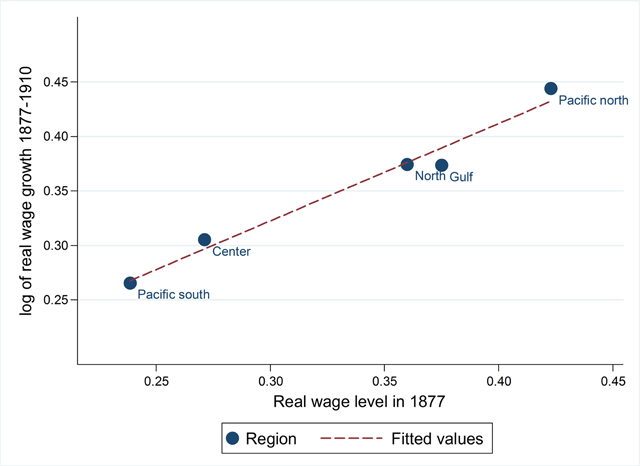
Figure 9
β-divergence of real wages across Mexican regions.
Source: See in text.
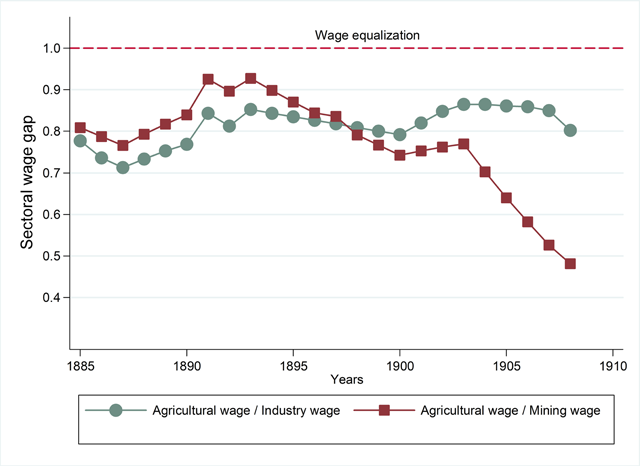
Figure 10
Agricultural real wage gap to industry and mining.
Source: See in text.
Note: Regionally-adjusted wages from the corresponding sector.