

Figure 1
Business models discussed internally following the release of Plan S
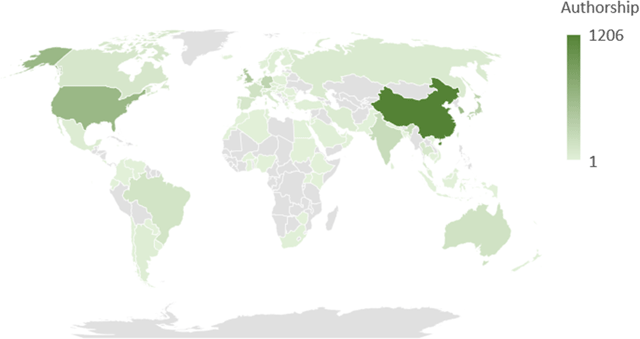
Figure 2
Geographic distribution of corresponding authors in Microbiology Society journals, 2016–2018. The intensity of colour indicates the number of authors in a country

Figure 3
A continuum of business models
Table 1
Annual spend among engaged institutions, given a hypothetical 125 engaged institutions per quartile
| Description | Totalrevenue | Mean spend per institution | |
|---|---|---|---|
| Quartile 1 | One or two subscriptions plus one or two APCs | £375,000 | £3,000 |
| Quartile 2 | Three subscriptions plus APCs or four subscriptions | £875,000 | £7,000 |
| Quartile 3 | All hybrid journals plus one or two APCs | £1,125,000 | £9,000 |
| Quartile 4 | All hybrid journals plus three or more APCs | £1,375,000 | £11,000 |
Table 2
Rules for uptake of P&R packages depending on how much the price varies from current spend
| Variance from current spend | Uptake |
|---|---|
| Increase more than £3,000 | 0% |
| Increase £2,000–£3,000 | 5% |
| Increase up to £2,000 | 15% |
| Equal price | 50% |
| Saving up to £1,500 | 75% |
| Saving £1,500–£2500 | 85% |
| Saving more than £2,500 | 95% |
Table 3
The impact of P&R on revenues at different package price points
| Institutional uptake* | P&R revenue | Non-P&R revenue | Total revenue | Variance from current revenue | |
|---|---|---|---|---|---|
| P&R at £3,000 | 420 (84%) | £1,256,250 | £356,250 | £1,612,500 | –£2,137,500 |
| P&R at £7,000 | 288 (58%) | £2,012,500 | £1,050,000 | £3,062,500 | –£687,500 |
| P&R at £8,000 | 232 (46%) | £1,850,000 | £1,468,750 | £3,318,750 | –£431,250 |
| P&R at £9,000 | 188 (38%) | £1,687,500 | £1,887,500 | £3,575,000 | –£175,000 |
| P&R at £11,000 | 82 (16%) | £893,750 | £2,893,750 | £3,787,500 | £37,500 |
[i] * Numbers of institutions opting for P&R were calculated for each quartile of spend, with the number rounded down to the nearest integer

Figure 4
Revenues from P&R compared with subscription attrition
Table 4
The impact of P&R on the proportion of OA in the four hybrid journals in the Microbiology Society portfolio
| OA % in 2018 | OA as % of journal in 2024 under different P&R package prices | |||||
|---|---|---|---|---|---|---|
| £3,000 | £7,000 | £8,000 | £9,000 | £11,000 | ||
| Journal 1 | 16.95% | 72.32% | 49.72% | 40.11% | 32.20% | 14.12% |
| Journal 2 | 22.48% | 94.95% | 65.14% | 52.75% | 42.66% | 18.35% |
| Journal 3 | 5.41% | 23.17% | 15.83% | 12.74% | 10.42% | 4.63% |
| Journal 4 | 1.38% | 5.91% | 3.99% | 3.30% | 2.61% | 1.10% |