
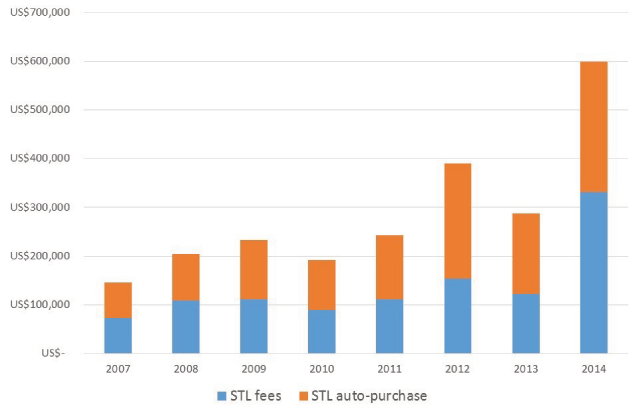
Figure 1
DDA expenditure 2007 to 2014
Table 1
Reuse following purchase
| Period | Type of auto-purchase | Total purchased | Total reused within period | Total % reused within period |
|---|---|---|---|---|
| 5 Sep 16 to 5 Mar 17 | STL auto-purchase | 559 | 378 | 68% |
| 5 Sep 15 to 5 Mar 16 | STL auto-purchase | 330 | 203 | 62% |
| 5 Sep 16 to 5 Mar 17 | ATO purchase | 654 | 401 | 61% |
Table 2
Number of reuse events following purchase
| Period | Type of auto-purchase | Reused 1 time | Reused 2–5 times | Reused 6+ times |
|---|---|---|---|---|
| 5 Sep 16 to 5 Mar 17 | STL auto-purchase | 15% | 42% | 43% |
| 5 Sep 15 to 5 Mar 16 | STL auto-purchase | 22% | 32% | 46% |
| 5 Sep 16 to 5 Mar 17 | ATO purchase | 21% | 43% | 36% |
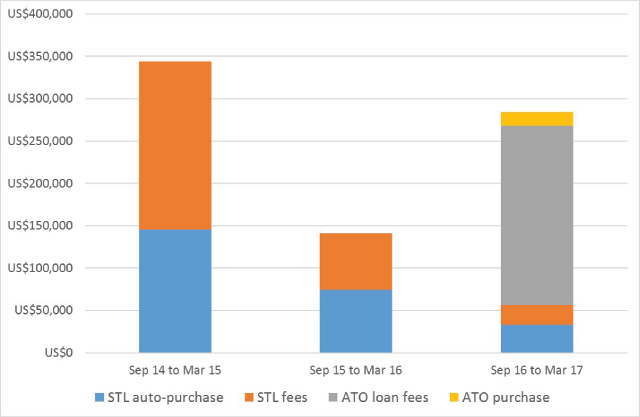
Figure 2
US$ expenditure by DDA category in six-month period
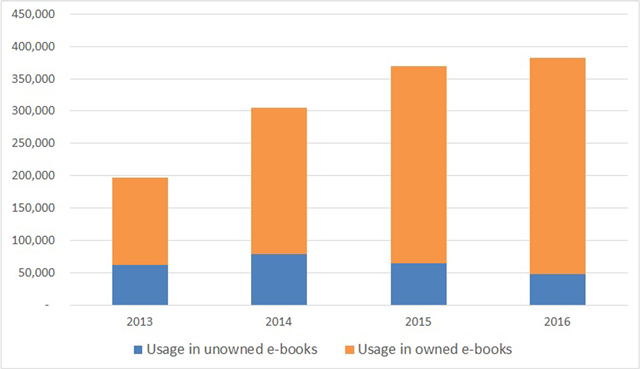
Figure 3
Usage in owned compared with unowned DDA e-books