

Table 1
Characteristics of the study participants.
| Characteristics of the study population | All n=346 | Men n=229 | Women n=117 | P value* |
|---|---|---|---|---|
| Age (years), mean (SD) | 54.1 (13.3) | 54.8 (13.1) | 52.8 (13.6) | 0.22 |
| Polyp type, n (%) | 0.02 | |||
| Non-adenomatous | 70 (20.2) | 38 (16.6) | 32 (27.1) | |
| Adenomatous | 276 (79.8) | 191 (83.4) | 85 (72.9) | |
| Polyp size (cm), n (%) | 0.84 | |||
| <1 | 147 (42.5) | 95 (41.5) | 52 (44.4) | |
| 1-2 | 134 (38.7) | 91 (39.7) | 43 (36.8) | |
| >2 | 65 (18.8) | 43 (18.8) | 22 (18.8) |
Table 2
Distribution of non-adenomatous and adenomatous polyps by gender.
| Polyp types | Total | Men | Women | P value |
|---|---|---|---|---|
| Non-adenomatous polyps, n (%) | 70 | 38 | 32 | 0.92 |
| Hyperplastic | 50 (71.4) | 28 (73.6) | 22 (68.8) | |
| Inflamatory | 14 (20.0) | 7 (18.5) | 7 (21.8) | |
| Juvenile | 6 (8.6) | 3 (7.9) | 3 (9.4) | |
| Adenomatous polyps, n (%) | 276 | 191 | 85 | <0.01 |
| Tubular | 205 (74.4) | 151 (79.1) | 54 (46.6) | |
| Tubulovillous | 59 (21.3) | 31 (13.5) | 28 (23.7) | |
| Villous | 12 (4.3) | 9 (3.9) | 3 (2.5) |
Table 3
Distribution of polyps by size.
| Polyp types | Polyp Size | ||
|---|---|---|---|
| < 1 cm | 1-2 cm | > 2 cm | |
| Non-adenomatous polyps, n (%) | 58 (82.8) | 11 (15.7) | 1 (1.5) |
| Hyperplastic | 47 (94.0) | 3 (6.0) | - |
| Inflamatory | 11 (78.6) | 3 (21.4) | - |
| Juvenile | - | 5 (83.3) | 1 (16.7) |
| Adenomatous polyps, n (%) | 89 (32.3) | 123 (44.5) | 64 (23.2) |
| Tubular | 82 (40.0) | 99 (43.3) | 24 (11.7) |
| Tubulovillous | 7 (11.9) | 19 (32.2) | 33 (55.9) |
| Villous | - | 5 (41.7) | 7 (58.3) |
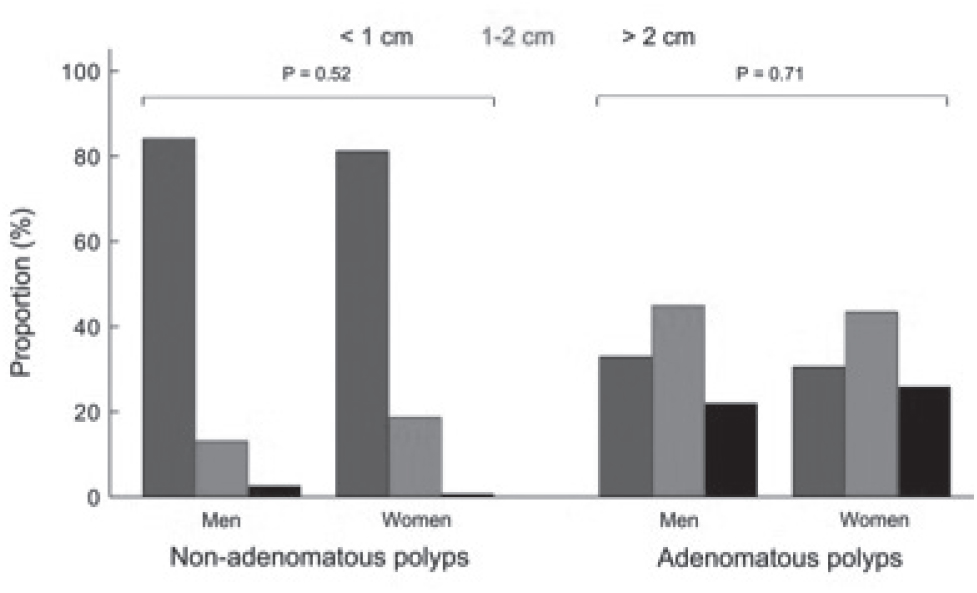
Figure 1
Gender differences pertaining to polyp size.
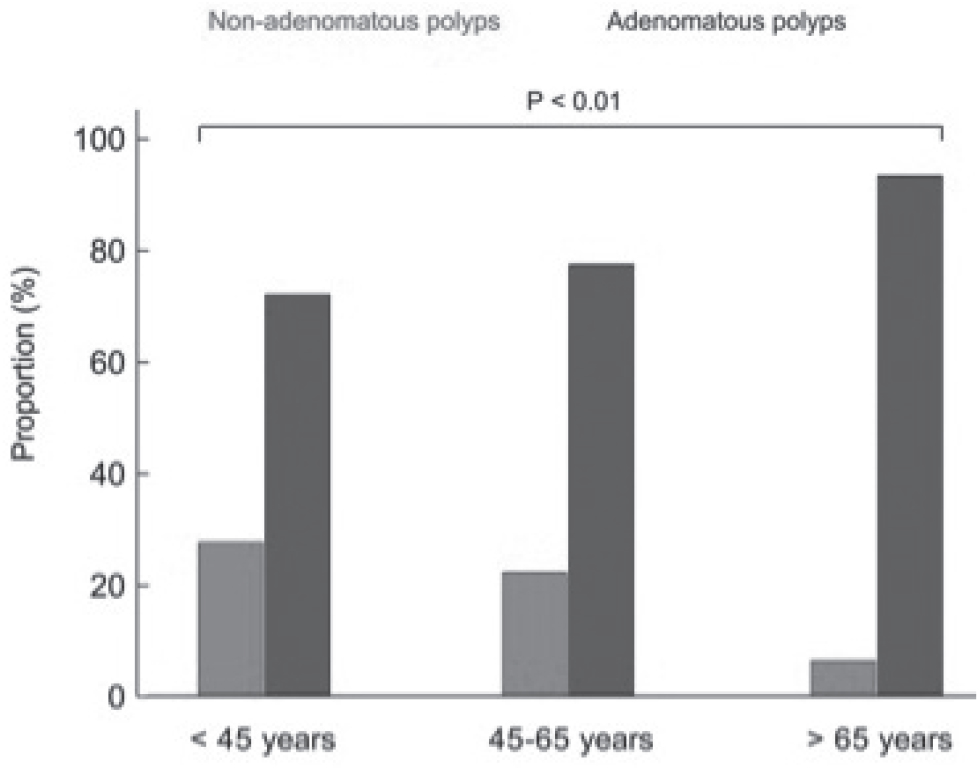
Figure 2
The distribution of polyps by age.
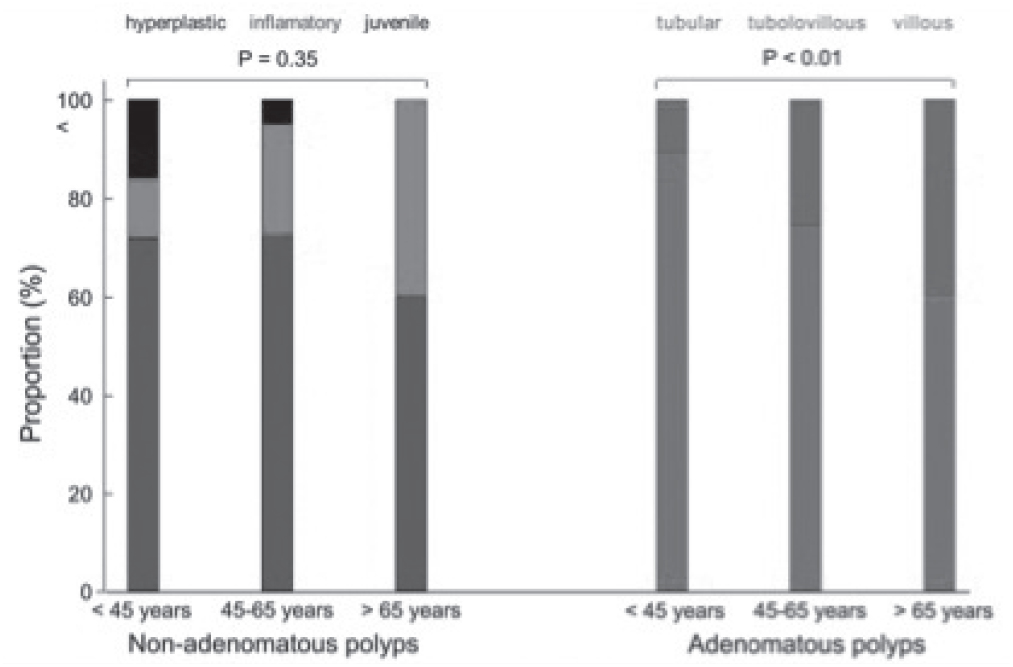
Figure 3
Age differences in the distribution of polyps.