Figure 1
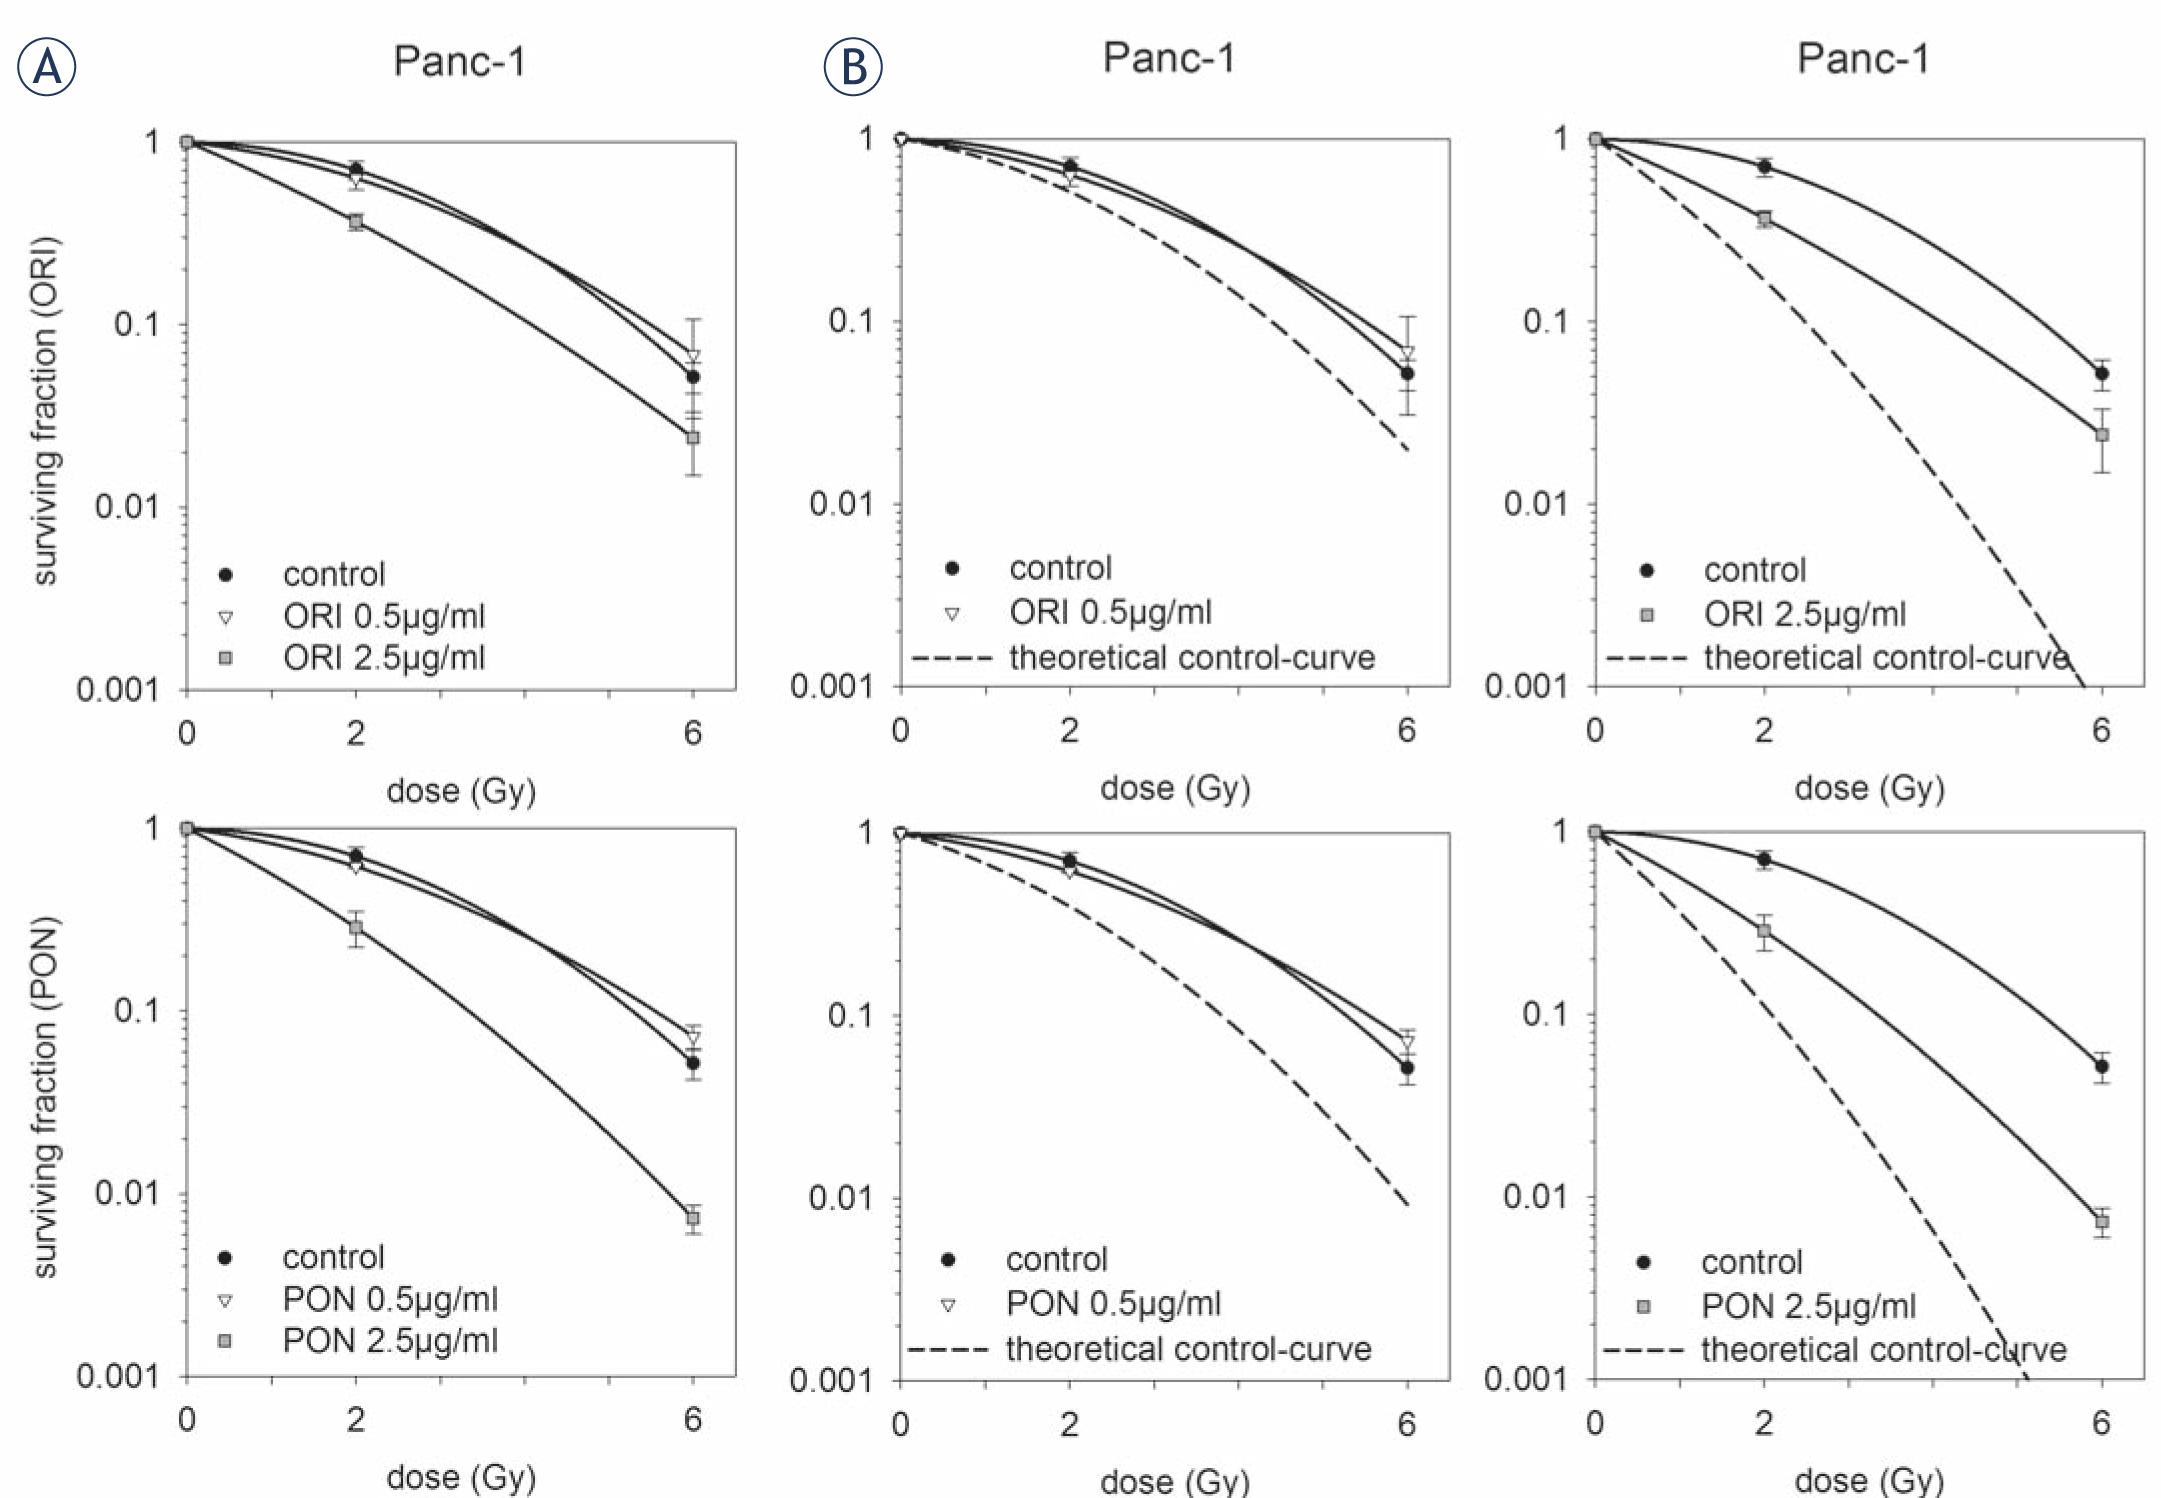
Figure 2
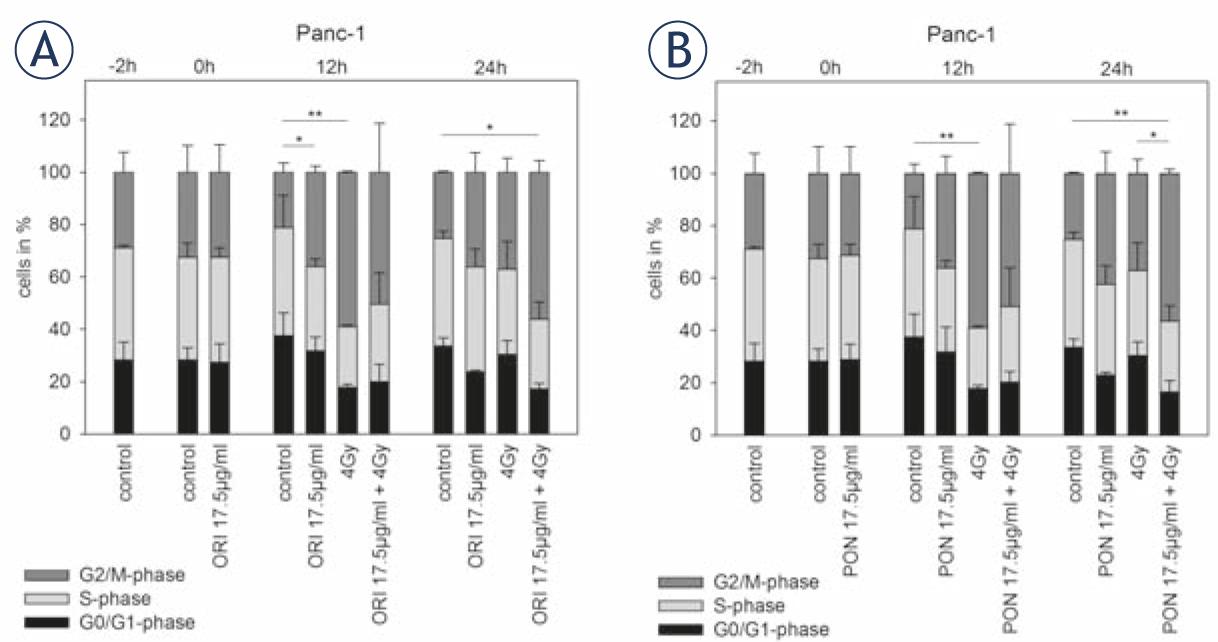
Figure 3
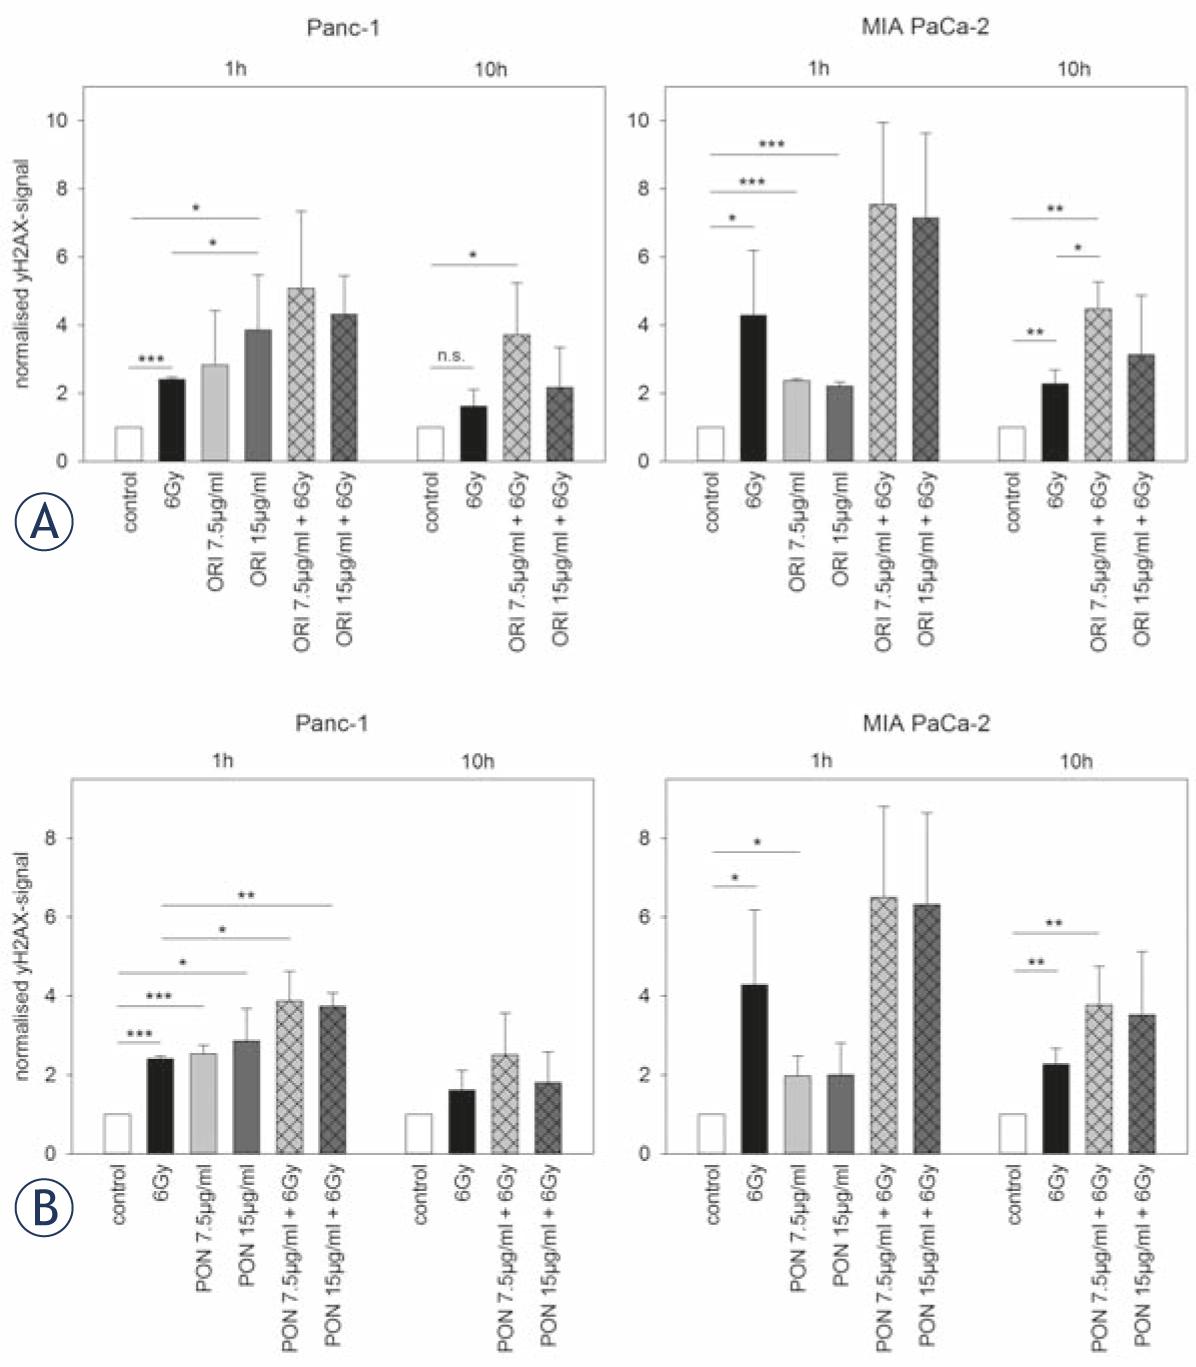
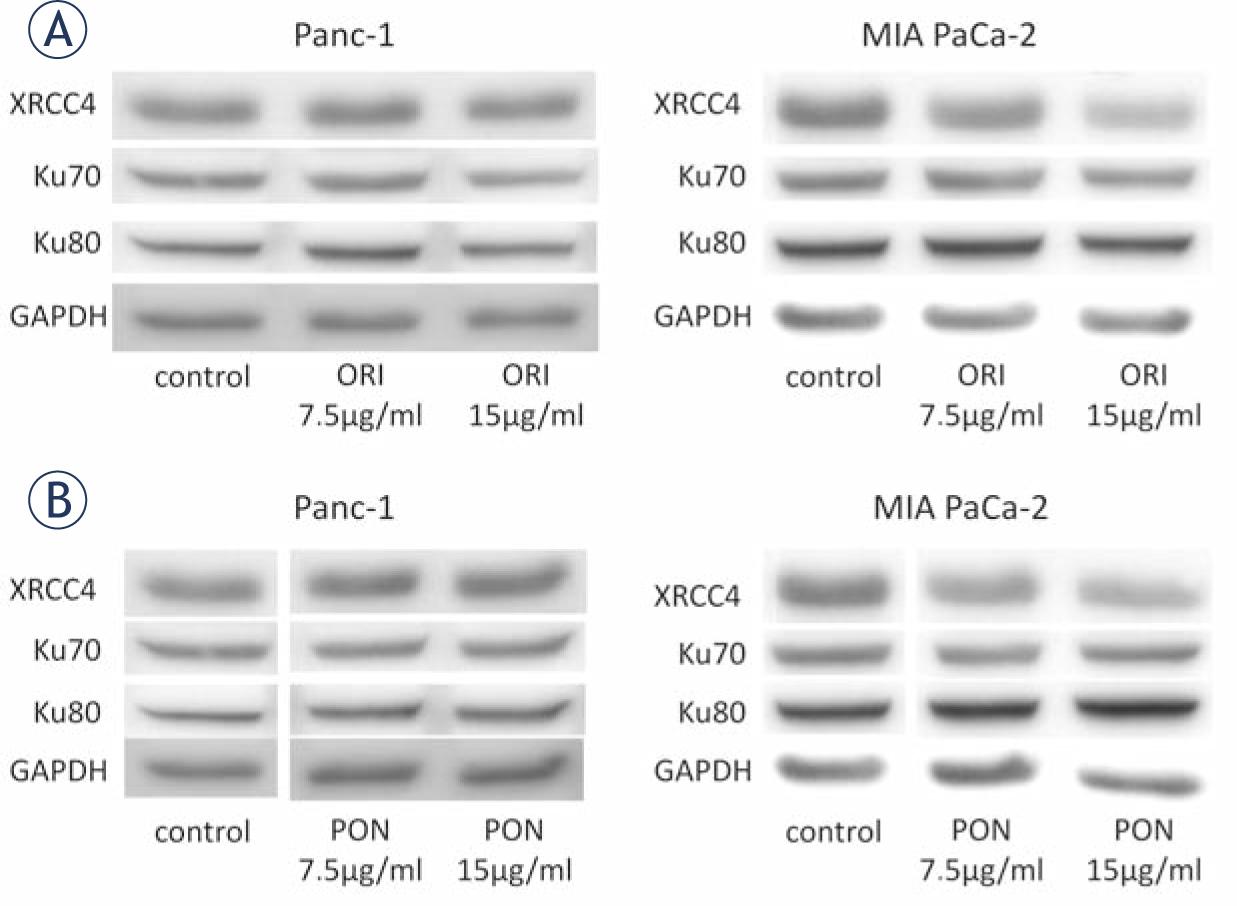
Figure 4

© 2017 Jakob Liermann, Patrick Naumann, Franco Fortunato, Thomas E. Schmid, Klaus-Josef Weber, Jürgen Debus, Stephanie E. Combs, published by Association of Radiology and Oncology
This work is licensed under the Creative Commons Attribution-NonCommercial-NoDerivatives 3.0 License.