
Figure 1
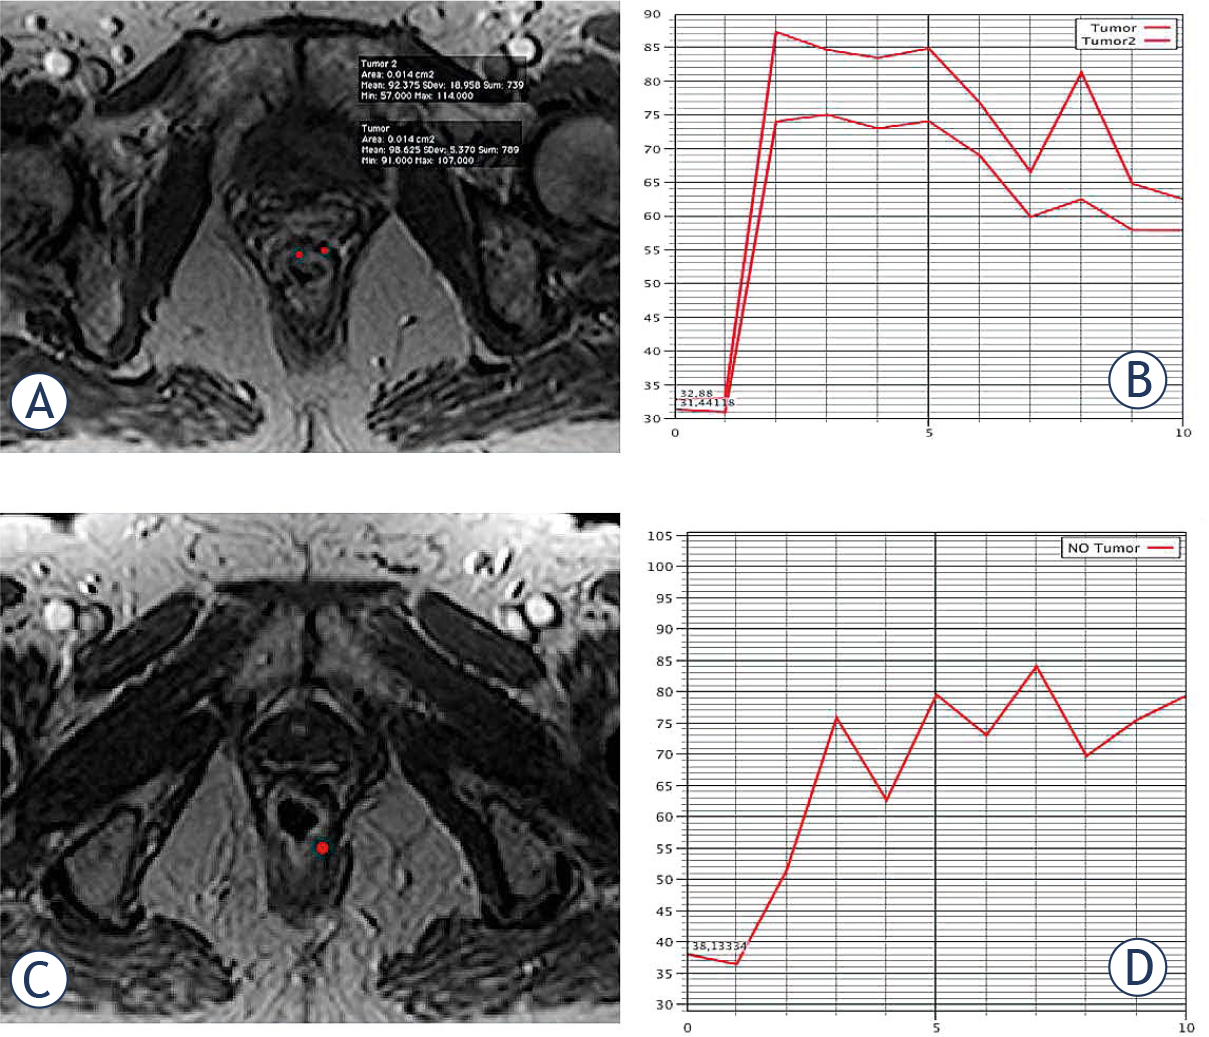
T1 weighted post contrast scan obtained before (A)-(B) and after (C)-(D) chemo-radiotherapy (CRT). The analysis of time intensity curve (TIC) show areas with rapid contrast uptake and fast discharge (B). After CRT, on the same areas no pathological contrast uptake is present confirming that hypo-intense tissue are tumour nests but only residual inflammation due to CRT.
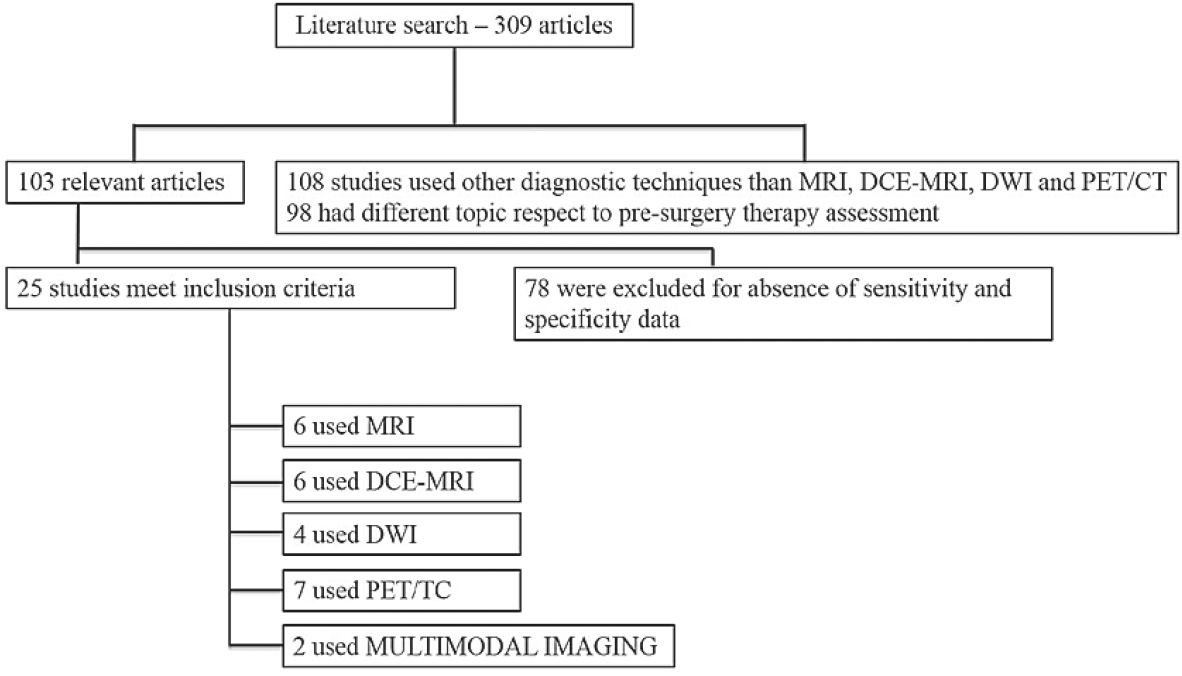
Figure 2
Included and excluded studies in systematic review.
DCE-MRI = dynamic contrast enhanced MRI; DWI = diffusion weighted imaging
Table 1
Number of studies and participants for each diagnostic modality
| Diagnostic modality | Studies | Participants |
|---|---|---|
| MRI | 6 | 329 |
| DCE-MRI | 6 | 340 |
| DWI | 4 | 133 |
| PET/CT | 7 | 366 |
| MULTIMODAL IMAGING | 2 | 70 |
[i] DCE-MRI = dynamic contrast enhanced MRI; DWI = diffusion weighted imaging
Table 2
Main characteristics summary of included studies in the systematic review: for each study the table reports imaging modality used; number of patients examined; parameters examined
| Imaging modality | Authors | Approach | N. patients | Gold standard |
|---|---|---|---|---|
| Barbaro et al.69 | Score system | 53 | TNM | |
| Denecke et al.46 | Morphologic criteria | 23 | TNM | |
| MRI | Dresen et al.45 | Morphologic + volumetric criteria | 67 | TNM |
| Intven et al.56 | Relative volume | 51 | TRG | |
| Petrillo et al.52 | Score system | 106 | TRG | |
| Petrillo et al.64 | Relative volume | 29 | TRG | |
| Intven et al.56 | Relative Ktrans | 51 | TRG | |
| Kim et al.55 | Relative Ktrans | 50 | TNM | |
| DCE-MRI | Martens et al.67 | TIC slope | 30 | TRG |
| Petrillo et al.52 | TIC visual inspection | 106 | TRG | |
| Petrillo et al.64 | Relative volume | 29 | TRG | |
| Petrillo et al.53 | Standardized index of shape | 74 | TRG | |
| Birlik et al.65 | ADC | 43 | TRG | |
| DWI | Ippolito et al.40 | ADC | 30 | TRG |
| Monguzzi et al.68 | ADC | 31 | TRG | |
| Petrillo et al.64 | Relative volume | 29 | TRG | |
| MULTIMODAL IMAGING | Intven et al.56 | Relative volume + relative Ktrans | 51 | TRG |
| Marouf et al.63 | MRI + DWI Score system | 19 | TNM | |
| Altini et al.36 | SUV | 68 | TRG | |
| Capirci et al.42 | SUV | 81 | TRG | |
| Ippolito et al.40 | SUV | 30 | TRG | |
| PET/CT | Murcia et al.43 | SUV | 41 | TRG |
| Sun et al.41 | Total lesion glycolysis | 35 | TRG | |
| Yoon et al.66 | Dual-point index | 61 | TRG | |
| Palma et al.73 | SUV | 50 | TRG |
[i] ADC = apparent diffusion coefficient; DWI = diffusion weighted imaging; SUV = standardized uptake value; TIC = time intensity curve; TRG = tumour regression grade
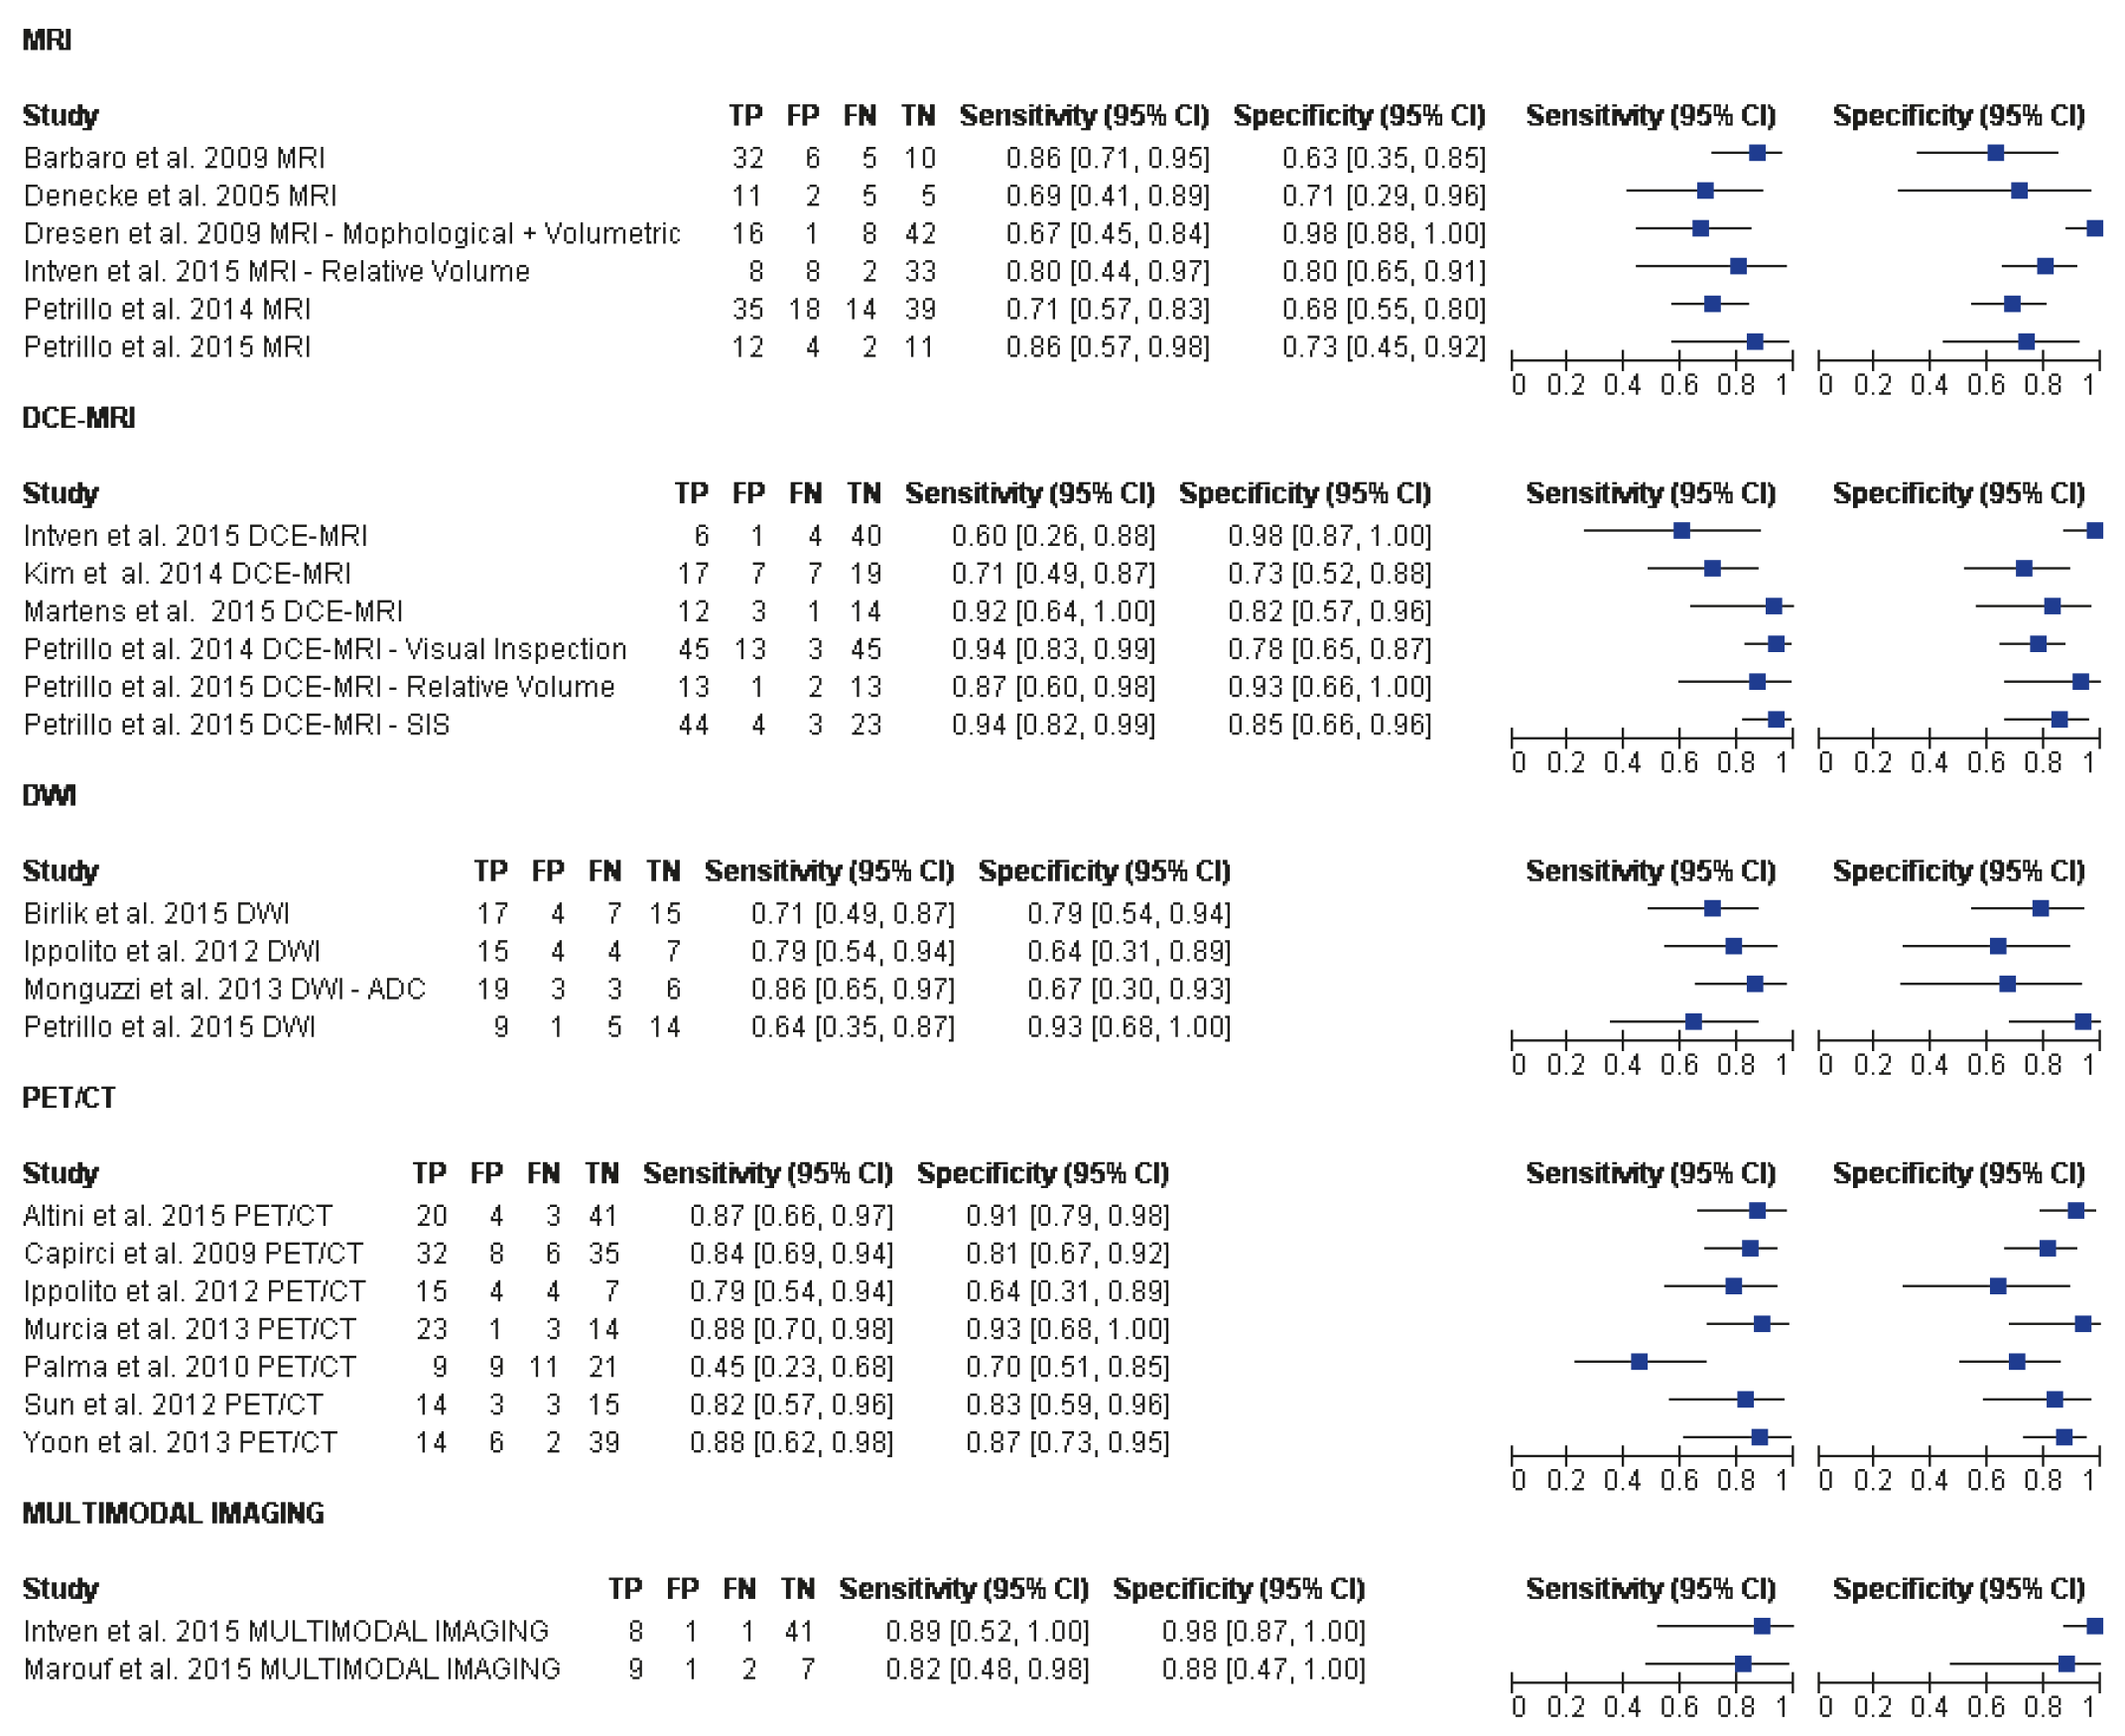
Figure 3
Forest plot subdivide for imaging modality including sensitivity and specificity estimates and their confidence intervals (95%).
CI = confidence interval; FN = false negative; FP = false positive; SIS = standardized index of shape; TN = true negative; TP = true positive
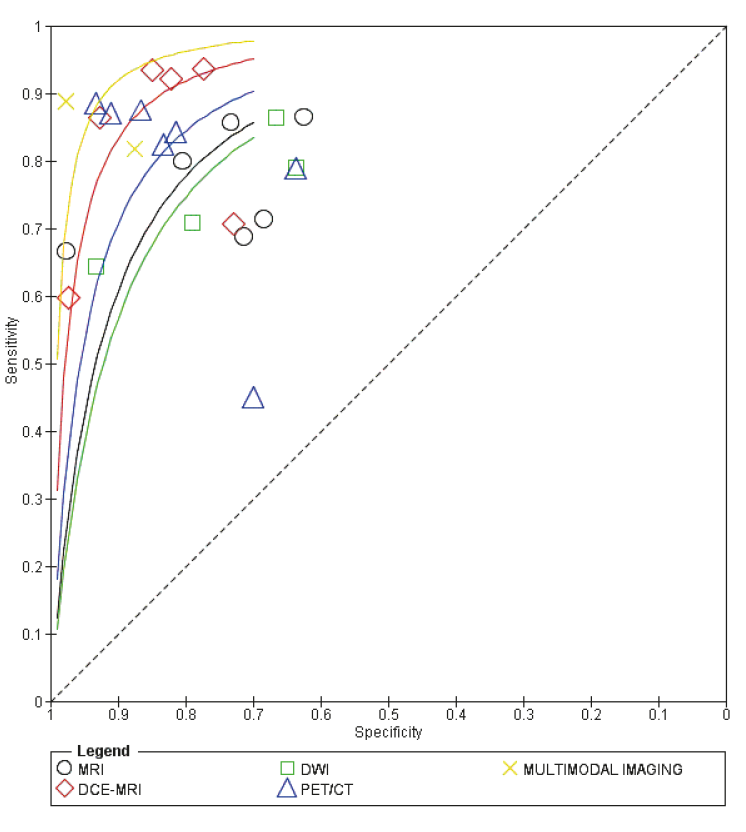
Figure 4
Estimated summary ROC curves and original data points for imaging techniques.
DCE-MRI = dynamic contrast enhanced MRI; DWI = diffusion weighted imaging
Table 3
Performance pooled analysis for MRI, diffusion weighted imaging (DWI), dynamic contrast enhanced MRI (DCE-MRI), PET/CT and multimodal imaging
| Performance Pooled Analysis | Sensitivity | Specificity | Positive predictive value | Negative predictive value | Accuracy |
|---|---|---|---|---|---|
| MRI | 75,84 | 78,21 | 74,34 | 79,55 | 77,13 |
| DCE-MRI | 87,18 | 84,15 | 82,42 | 88,51 | 85,55 |
| DWI | 75,95 | 79,25 | 84,51 | 68,85 | 77,27 |
| PET/CT | 80,25 | 83,08 | 79,27 | 83,92 | 81,82 |
| MULTIMODAL IMAGING | 85,00 | 96,08 | 89,47 | 94,23 | 92,96 |
[i] DCE-MRI = dynamic contrast enhanced MRI; DWI = diffusion weighted imaging
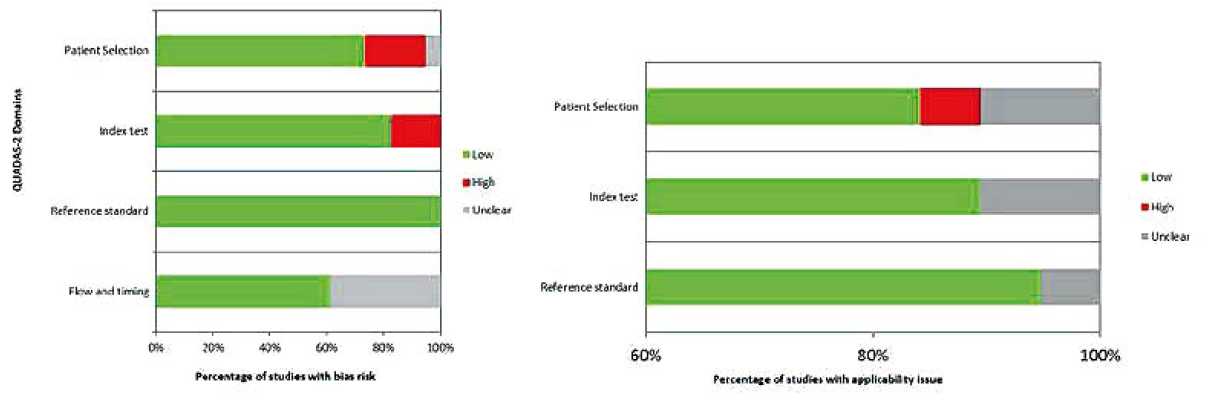
Figure 5
Assessment of bias risk and applicability analysis.