
Figure 1
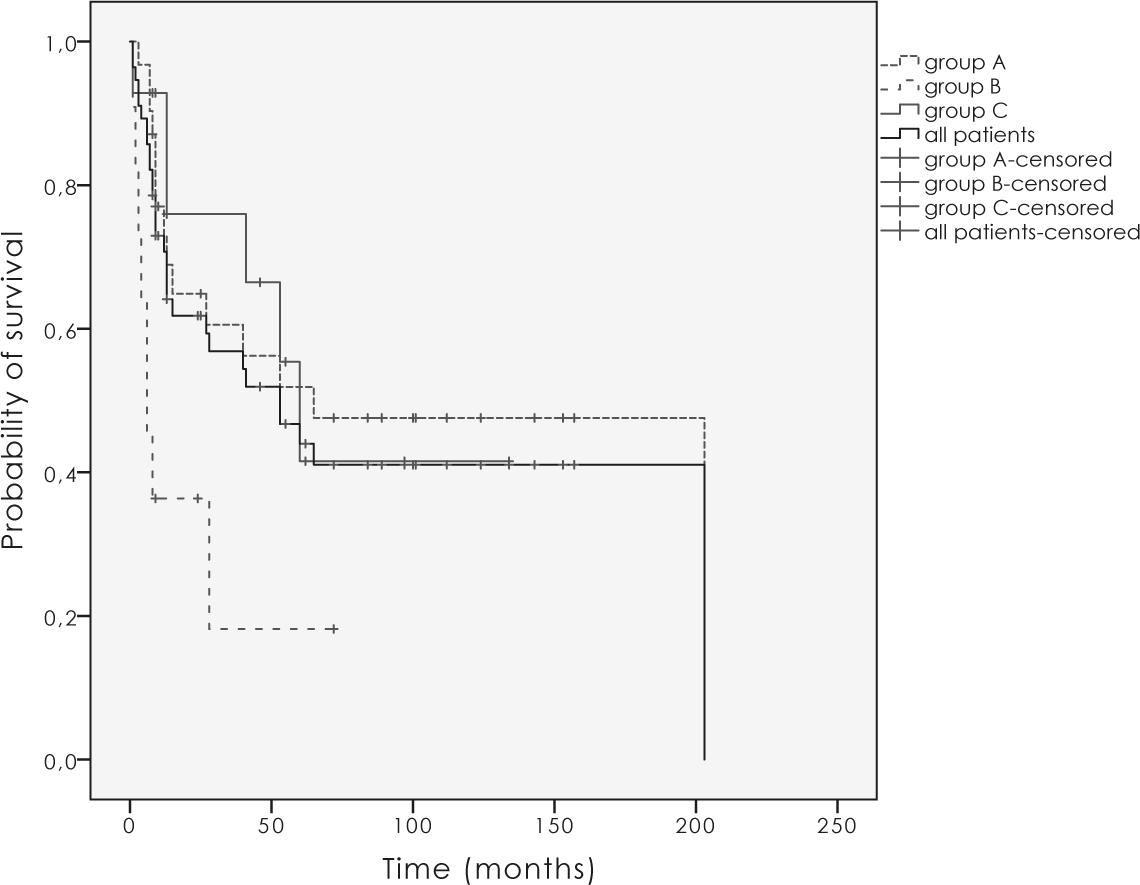
Figure 2
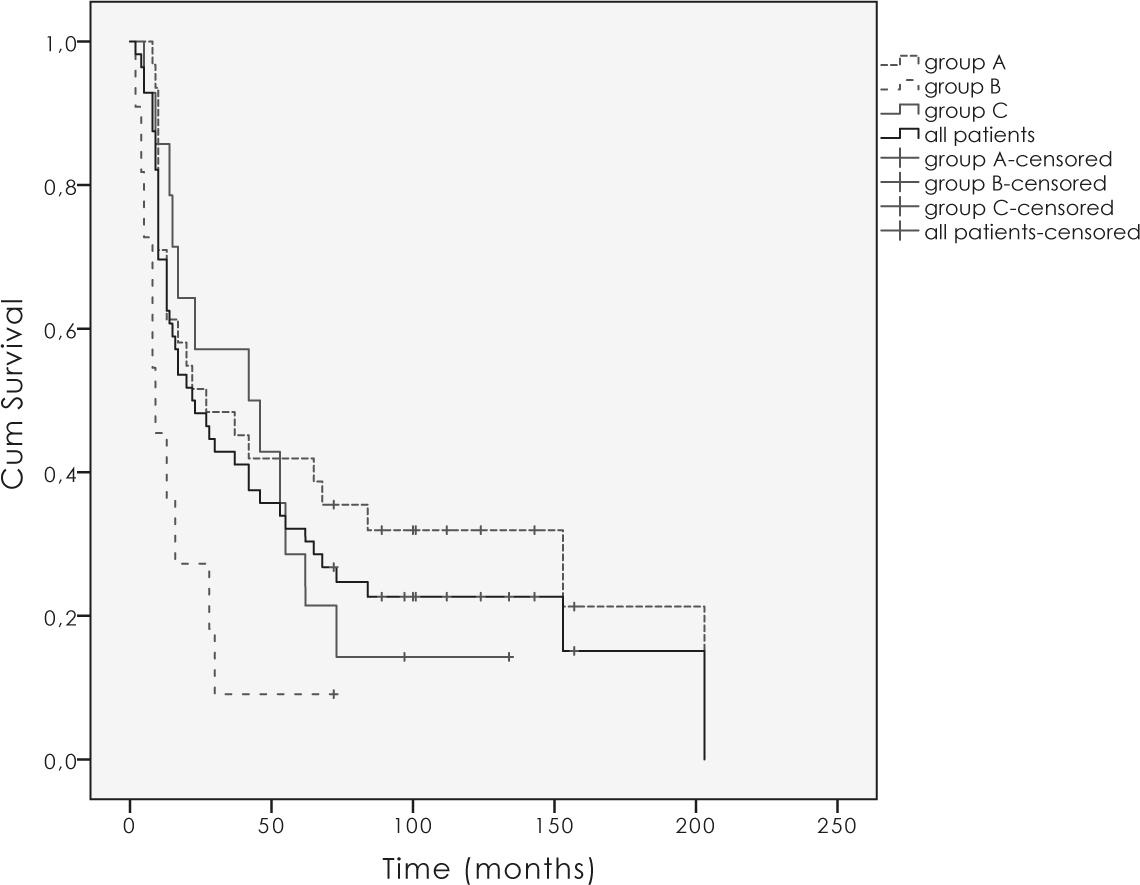
Figure 3
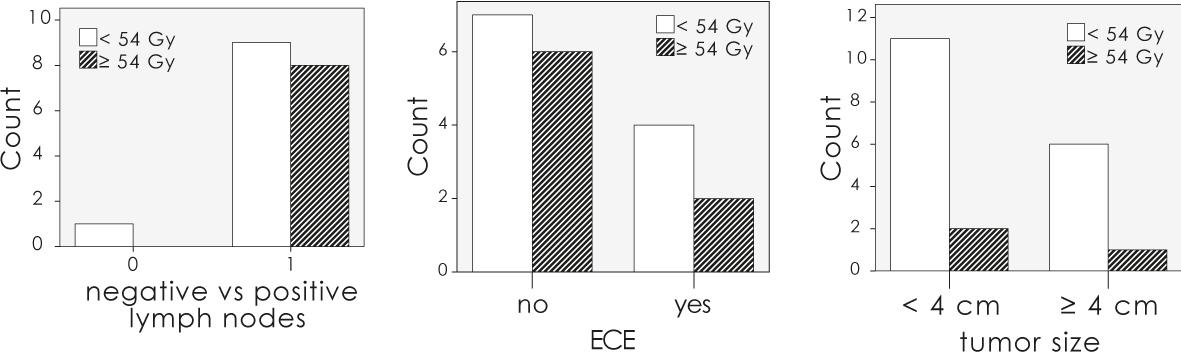
Figure 4
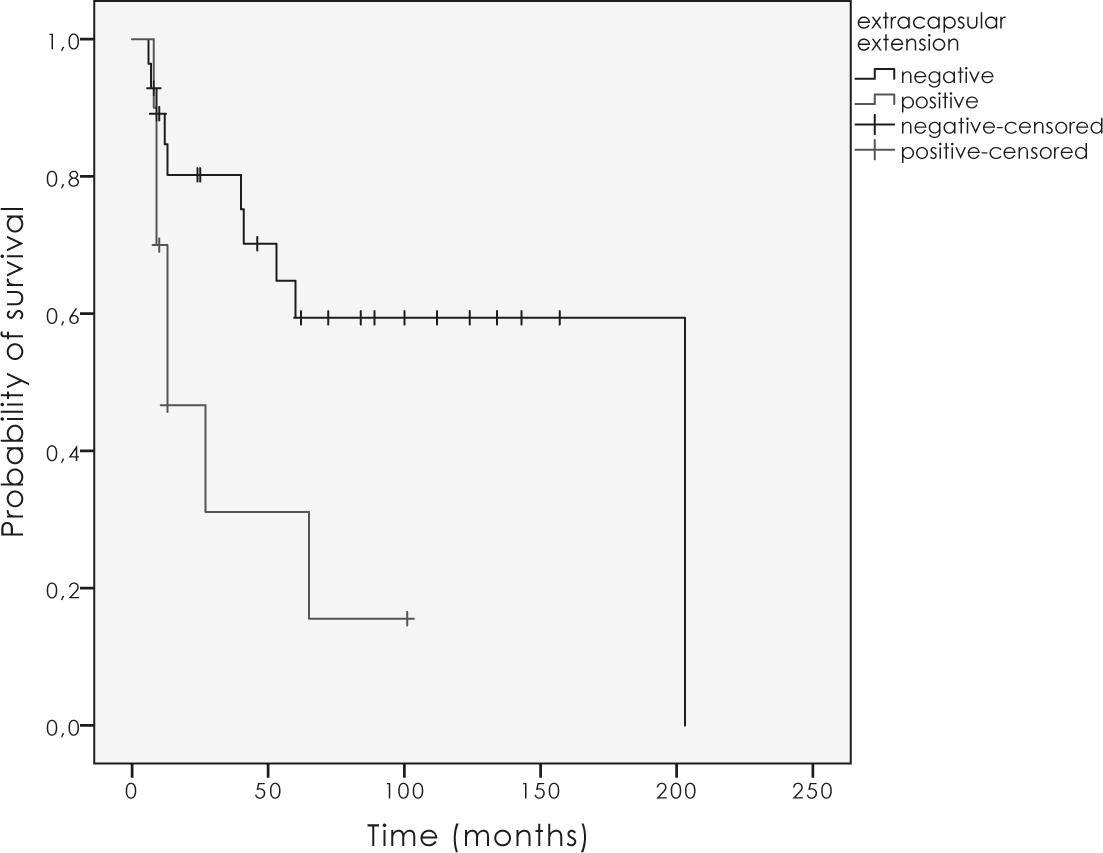
Figure 5
Patients, tumor and treatment characteristcs
| characteristics | All | Primary operated | Primary irradiated | Relapse group |
|---|---|---|---|---|
| group A | group B | C | ||
| Number of patients (%) | 56 (100.0%) | 31 (55.4%) | 11 (19.6%) | 14 (25%) |
| Mean age (years) (+/-SD) | 74.4 (+/-9.7) | 74.9 ( +/- 9.8) | 67.9 (+/-10.8) | 87.2 (+/- 6.1) |
| Median follow-up time (months) | 22.5 (2-203) | 27 (8-203) | 9 (2-72) | 44 (5-134) |
| FIGO stage | ||||
| i | 5 (8.9%) | 0 | 0 | 5 (35.7%) |
| ii | 4 (7.1%) | 0 | 0 | 4 (28.6%) |
| iii | 33 (58.9%) | 23 (74.2%) | 6 (54.5%) | 4 (28.6%) |
| IV | 11 (19.6%) | 7 (22.6%) | 4 (36.4%) | 0 |
| not specified | 3 (5.4%) | 1 (3.2%) | 1 (9.1%) | 1 (7.1%) |
| histopathologic grade | ||||
| G1 | 21 (37.5%) | 11 (35.5%) | 3 (27.3%) | 7 (50.0%) |
| G2 | 25 (44.6%) | 15 (48.4) | 7 (63.6%) | 3 (21.4%) |
| G3 | 5 (8.9%) | 3 (9.7%) | 1 (9.1%) | 1 (7.1%) |
| not specified | 5 (8.9%) | 2 (6.5%) | 0 | 3 (21.4%) |
| T stage | ||||
| T1 | 5 (8.9%) | 2 (6.5%) | 0 | 3 (21.4%) |
| T2 | 26 (46.4%) | 18 (58.1%) | 1 (9.1%) | 7 (50.0%) |
| T3 | 16 (28.6%) | 9 (29.0%) | 7 (63.6%) | 0 |
| T4 | 3 (5.4%) | 1 (3.2%) | 2 (18.2%) | 0 |
| not specified | 6 (10.7%) | 1 (3.2%) | 1 (9.1%) | 4 (28.6%) |
| Diameter of primary tumor | ||||
| ≤ 2 cm | 10 (17.9%) | 7 (22.6%) | 0 | 3 (21.4%) |
| > 2 and ≤ 4 cm | 23 (41.1%) | 16 (51.6%) | 3 (27.3%) | 4 (28.6%) |
| > 4 cm | 12 (21.5%) | 5 (16.2%) | 6 (54.5%) | 1 (7.1%) |
| not specified | 11 (19.6%) | 3 (9.7%) | 2 (18.2%) | 6 (42.9%) |
| Tumor invasion | ||||
| lower urethra | 9 (16.1%) | 3 (9.7%) | 6 (54.5%) | 0 |
| vagina | 15 (26.8%) | 8 (25.8%) | 7 (63.6%) | 0 |
| anus | 1 (1.8%) | 0 | 1 (9.1%) | 0 |
| bladder wall | 0 | 0 | 1 (9.1%) | 0 |
| rectal wall | 1 (1.8%) | 0 | 1 (9.1%) | 0 |
| pelvic bone | 2 (7.1%) | 1 (3.2%) | 1 (9.1%) | 0 |
| Tumor location | ||||
| clitoris | 6 (10.7%) | 4 (12.9%) | 0 | 2 (14.3%) |
| labium major | 10 (17.9%) | 5 (16.1%) | 1 (9.1%) | 4 (28.6%) |
| labium minor | 8 (14.3%) | 4 (12.9%) | 0 | 4 (28.6%) |
| comissura/more than one location | 28 (50.0%) | 16 (51.6%) | 10 (90.9%) | 2 (14.3%) |
| not specified | 4 (7.1%) | 2 (6.5%) | 0 | 2 (14.3%) |
| Nodal status | ||||
| N0 | 17 (30.3%) | 4 (12.9%) | 5 (45.5%) | 8 (57.1%) |
| N1 | 25 (44.6%) | 19 (61.3%) | 2 (18.2%) | 4 (28.6%) |
| N2 | 10 (17.9%) | 7 (22.6%) | 3 (27.3%) | 0 |
| not specified | 4 (7.1%) | 1 (3.2%) | 1 (9.1%) | 2 (14.3%) |
| Nodal metastases | ||||
| micrometastases | 9 (16.1%) | 7 (22.6%) | not specified | 2 (14.3%) |
| macrometastases | 25 (44.6%) | 18 (58.1%) | 5 (45.5%) | 2 (14.3%) |
| Exstracapsular tumor spread | ||||
| positive | 10 (17.9%) | 8 (25.8%) | not specified | 2 (14.3%) |
| Residual tumor after surgery | 20 (35.7%) | 16 (51.6%) | not specified | 4 (28.6%) |
| primary tumor site | 15 (26.8%) | 13 (41.9%) | not specified | 2 (14.3%) |
| nodal site | 7 (12.5%) | 4 (12.9%) | not specified | 3 (21.4%) |
| Mean dose to the tumor (Gy) (+/-SD) | 47.4 (+/-7.9) | 47.1 (+/-8.2) | 46.7 (+/-8.7) | 46.0 (+/-5.2) |
| Mean dose to the inguinofemoral area (Gy) (+/-SD) | ||||
| ipsilateral | 47.5 (+/-8.8) | 50.7 (+/-7.9) | 46.9 (+/-8.4) | 40.1 (+/-6.7) |
| contralateral | 49.7 (+/-9.7) | 53.4 (+/-7.8) | 44.9 (+/-9.8) | 37.4 (+/-6.9) |
| Mean dose to the pelvic area (Gy) (+/-SD) | ||||
| ipsilateral | 46.2 (+/-6.2) | 47.0 (+/-6.8) | 45.0 (+/-4.9) | 43.5 (+/-6.2) |
| contralateral | 44.6 (+/-10.5) | 44.7 (+/-12.5) | 45.0 (+/-4.9) | 39.1 (+/-4.9) |
Pattern of failure at the time of last follow-up
| All | Primary operated | Primary irradiated | Relapse group | |
|---|---|---|---|---|
| group A | group B | C | ||
| Local failure | 9 | 5 | 4 | 0 |
| Inguinal failure | 6 | 3 | 1 | 2 |
| Distant failure | 5 | 3 | 1 | 1 |
| Local and inguinal failure | 10 | 5 | 3 | 2 |
| Local/inguinal and distant failure | 5 | 2 | 1 | 2 |
| Overall failure | 35 | 18 | 10 | 7 |
| No evidence of disease | 21 | 13 | 1 | 7 |