
Table 1
Histological findings in the salivary glands of the rats. Mean values of salivary gland damage parameters are given. *Details of groups are given below the table
| Site of damage | Investigated parameters | Control | Group 1 | Group 2 | Group 3 | Group 4 | Group 5 | Group 6 | ||||||||||||||
|---|---|---|---|---|---|---|---|---|---|---|---|---|---|---|---|---|---|---|---|---|---|---|
| 1st m | 6th m | p | 1st m | 6th m | p | 1st m | 6th m | p | 1st m | 6th m | p | 1st m | 6th m | p | 1st m | 6th m | p | 1st m | 6th m | p | ||
| Edema | 3.67 | 5.5 | ns | 6 | 7.17 | ns | 5.67 | 7.67 | 0.05 | 5 | 5.5 | ns | 4.33 | 7 | 0.02 | 4.33 | 4.83 | ns | 5.67 | 3 | 0.02 | |
| Acinar epithelial cell damage | Vacuolization | 4.33 | 3.5 | ns | 6.67 | 6.33 | ns | 5 | 7 | 0.04 | 4.67 | 4.17 | ns | 4 | 5.33 | ns | 5 | 3.67 | ns | 5.33 | 2 | 0.02 |
| Peri acinar inflammation | 0 | 0 | ns | 0.67 | 0.17 | ns | 1.33 | 0.17 | ns | 0.67 | 0.17 | ns | 0 | 0.17 | ns | 0 | 0.17 | ns | 2 | 0 | 0.02 | |
| Necrosis | 0.67 | 2.33 | ns | 0 | 1.33 | 0.04 | 2 | 0.5 | ns | 1.67 | 1 | ns | 0 | 1 | ns | 0.33 | 0 | ns | 0.67 | 0.17 | ns | |
| Ductal system damage | Ectasia | 3 | 3.33 | ns | 6.33 | 5.83 | ns | 4.33 | 6 | ns | 3.67 | 2.5 | ns | 2.67 | 4.67 | 0.01 | 3.67 | 3.5 | ns | 3.33 | 0.83 | 0.04 |
| Periductal fibrosis | 0 | 0 | ns | 1 | 3.33 | 0.02 | 2.33 | 3.33 | ns | 1 | 0.33 | ns | 0 | 2.33 | 0.02 | 0 | 1.33 | 0.01 | 0 | 0.67 | ns | |
| Interstitial space damage | Periduktal sclerosis | 0 | 0.17 | ns | 0 | 2.17 | 0.02 | 1.33 | 1.83 | ns | 1 | 0 | 0.03 | 0 | 0.33 | ns | 0 | 0.67 | ns | 0 | 0 | ns |
| Periductal mucus leakage | 1 | 0.5 | ns | 1 | 1 | ns | 0.67 | 1.33 | ns | 1.33 | 1 | ns | 0.33 | 0.83 | ns | 0.33 | 0.33 | ns | 3 | 0.5 | 0.02 | |
| Vascular system damage | Sclerosis | 0 | 0.17 | ns | 1 | 4.5 | 0.01 | 1.67 | 3.5 | ns | 1.33 | 0.5 | ns | 0.67 | 1.17 | ns | 0 | 1.17 | 0.01 | 1.67 | 0.5 | ns |
| Total | 12.67 | 15.5 | ns | 22.67 | 31.83 | 0.02 | 24.33 | 31.33 | ns | 20.34 | 15.17 | 0.05 | 12 | 22.83 | 0.02 | 13.66 | 15.67 | ns | 21.67 | 7.67 | 0.02 | |
[i] Control = healthy subjects; Group 1= radioiodine; Group 2 = adipose tissue-derived mesenchymal stem cells; Group 3 = amifostine; Group 4 = radioiodine plus amifostine; Group 5 = radioiodine plus adipose tissue-derived mesenchymal stem cells concomitant; Group 6 = radioiodine plus adipose tissue-derived mesenchymal stem cells after 48 h; ns = not significant.
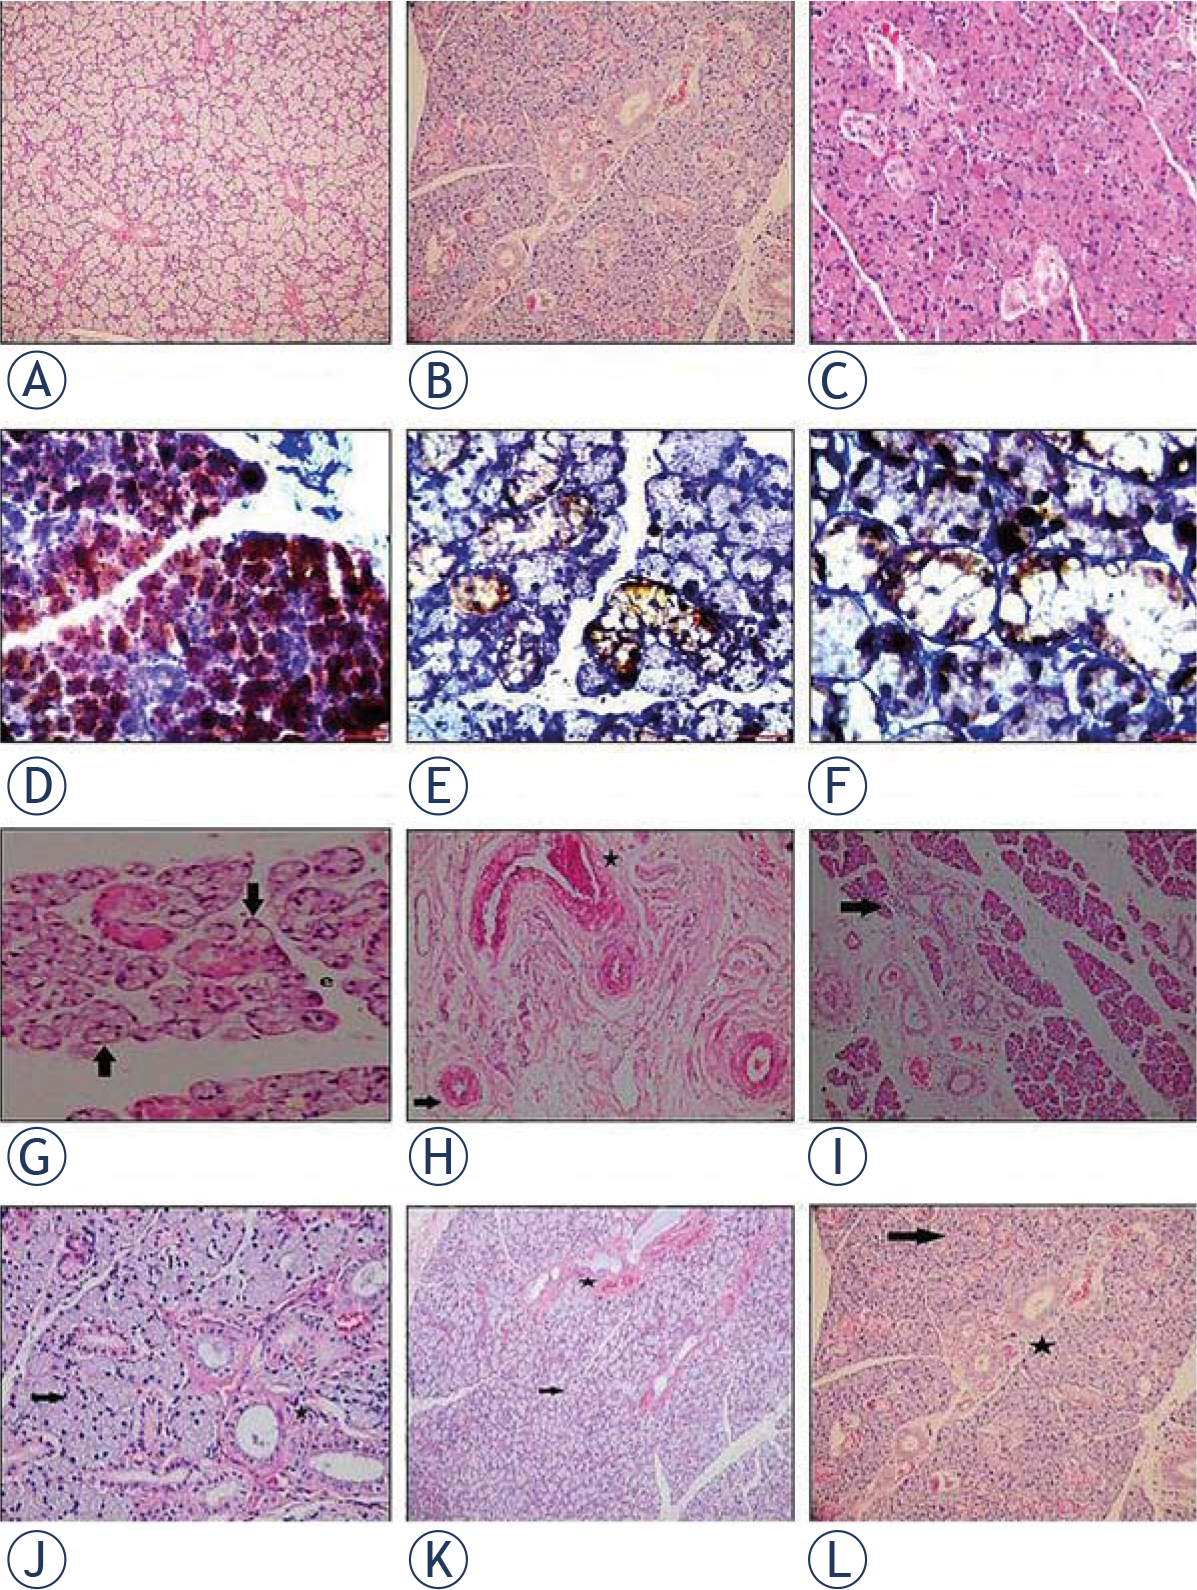
Figure 1
Histological photographs of salivary gland tissue samples. Pictures on the upper horizontal line show control groups at 1st month evaluation (A; haematoxylin and eosin (H&E)×40), and at 6th month evaluation in different magnifications (B; H&E×200, C; H&E×400). Pictures on the second horizontal line (D to F; ×200 Leica DM 1000) shows the localization of BrdU(+) Adipose Derived Mesenchimal Stem Cells (ADMSC) in the salivary gland (brown stained cells) at 1st month after its intraperitoneal injection in different magnifications. Radioiodine-induced damage in Group 1 is seen in pictures on the third horizontal line (G to I; H&E×400, H&E×400 and H&E×100). Massive vacuolization, necrosis (black arrow) and edema were shown in G minimal vacuolization (black arrow) and periductal fibrosis (black star) in H and lenfosit infiltration (black arrow) in I. Pictures on the lower horizontal line (J to L H&E×400, H&E×200 and H&E×40) indicates the improvements in the histological findings (including vacuolization, fibrosis and edema: black arrow; nearly normal mucous acini, black star; nearly normal ductal system) at 6th month evaluation after the late ADMSC administration in Group 6.
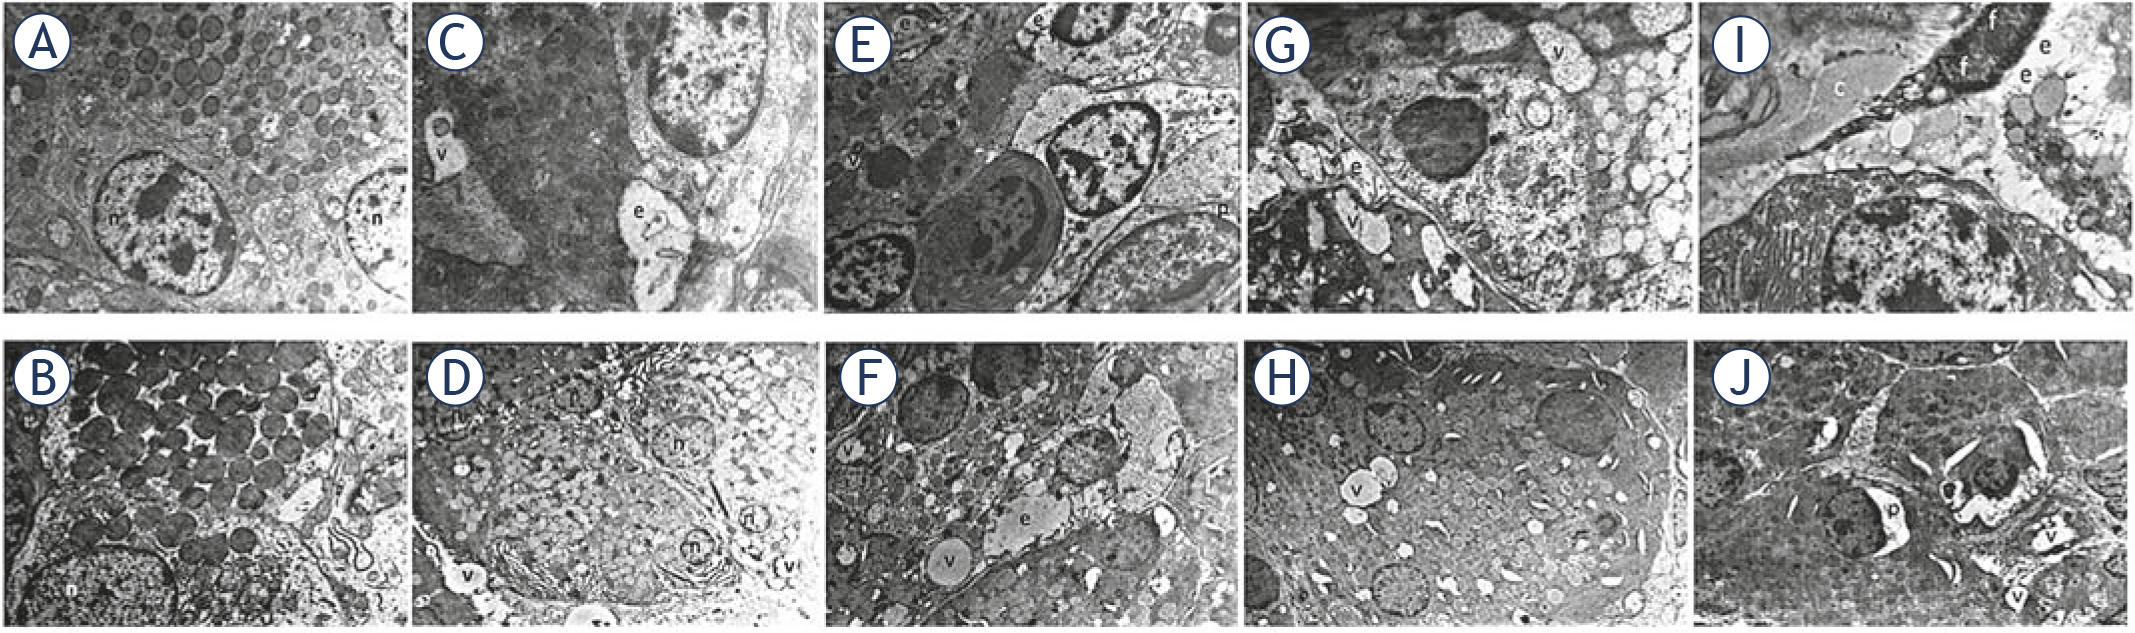
Figure 2
The figure (magnification × 5000) demonstrates the findings of electron microscopy at months 1 and 6. (A and B). Normal salivary gland samples of the control group. A and D. Intracellular vacuoles and intercellular edema related to radioiodine in Group 1. E and F. We observed intracellular vacuoles, intercellular edema, nucleus of fibroblast and collagen fibers (fibrosis) at 1st month evaluation in the treatment groups (Groups 5 and 6); G to J. Improvement in cellular damage at 6th month in the stem cell-administered groups (Groups 5 and 6). On the images; c: collagen fibers; e: intercellular edema; f: nucleus of fibroblast; n: nucleus, p: dilated perinuclear cistern; v: intracellular vacuoles.
Table 2
The mean values (the counts from left and right salivary glands) of the Smax, Tmax/Tmin and G/BGmax, and their statistical significance. Baseline and follow-up salivary gland scintigraphies were performed on the subjects who had single treatment (Group 1; radioiodine, Group 2; adipose tissue-derived mesenchymal stem cells, Group 3; amifostine) and combined treatments (Group 4; radioiodine plus amifostine, Group 5; radioiodine plus adipose tissue-derived mesenchymal stem cells concomitant, Group 6; radioiodine plus adipose tissue-derived mesenchymal stem cells after 48 h)
| Groups | Smax (%) | Tmax/Tmin | G/BGmax | |||||||||
|---|---|---|---|---|---|---|---|---|---|---|---|---|
| Baseline | 1st m | 6th m | p | Baseline | 1st m | 6th m | p | Baseline | 1st m | 6th m | p | |
| Group 1 | 34.80 | 29.58 | 19.72 | 0.04 | 0.07 | 0.08 | 0.14 | 0.05 | 1.63 | 1.38 | 1.30 | 0.04 |
| Group 2 | 34.74 | 34.31 | 34.62 | ns | 0.06 | 0.06 | 0.07 | ns | 1.59 | 1.57 | 1.58 | ns |
| Group 3 | 34.72 | 34.38 | 33.83 | ns | 0.08 | 0.08 | 0.09 | ns | 1.59 | 1.56 | 1.57 | ns |
| Group 4 | 33.07 | 30.30 | 28.88 | 0.04 | 0.08 | 0.08 | 0.09 | ns | 1.57 | 1.49 | 1.44 | 0.04 |
| Group 5 | 33.51 | 32.91 | 28.89 | 0.04 | 0.08 | 0.08 | 0.09 | ns | 1.58 | 1.52 | 1.49 | 0.04 |
| Group 6 | 35.55 | 31.60 | 26.07 | 0.04 | 0.07 | 0.07 | 0.09 | ns | 1.60 | 1.51 | 1.36 | 0.04 |
| p | ns | 0.01 | 0.01 | ns | ns | 0.03 | ns | 0.01 | 0.01 | |||
[i] G/BGmax = Gland-to-background ratio at a maximum count; ns = Not significant; Smax = Maximum secretion ratio; Tmax/Tmin = Ratio of the time to reach the maximum counts to the time to reach the minimum counts.
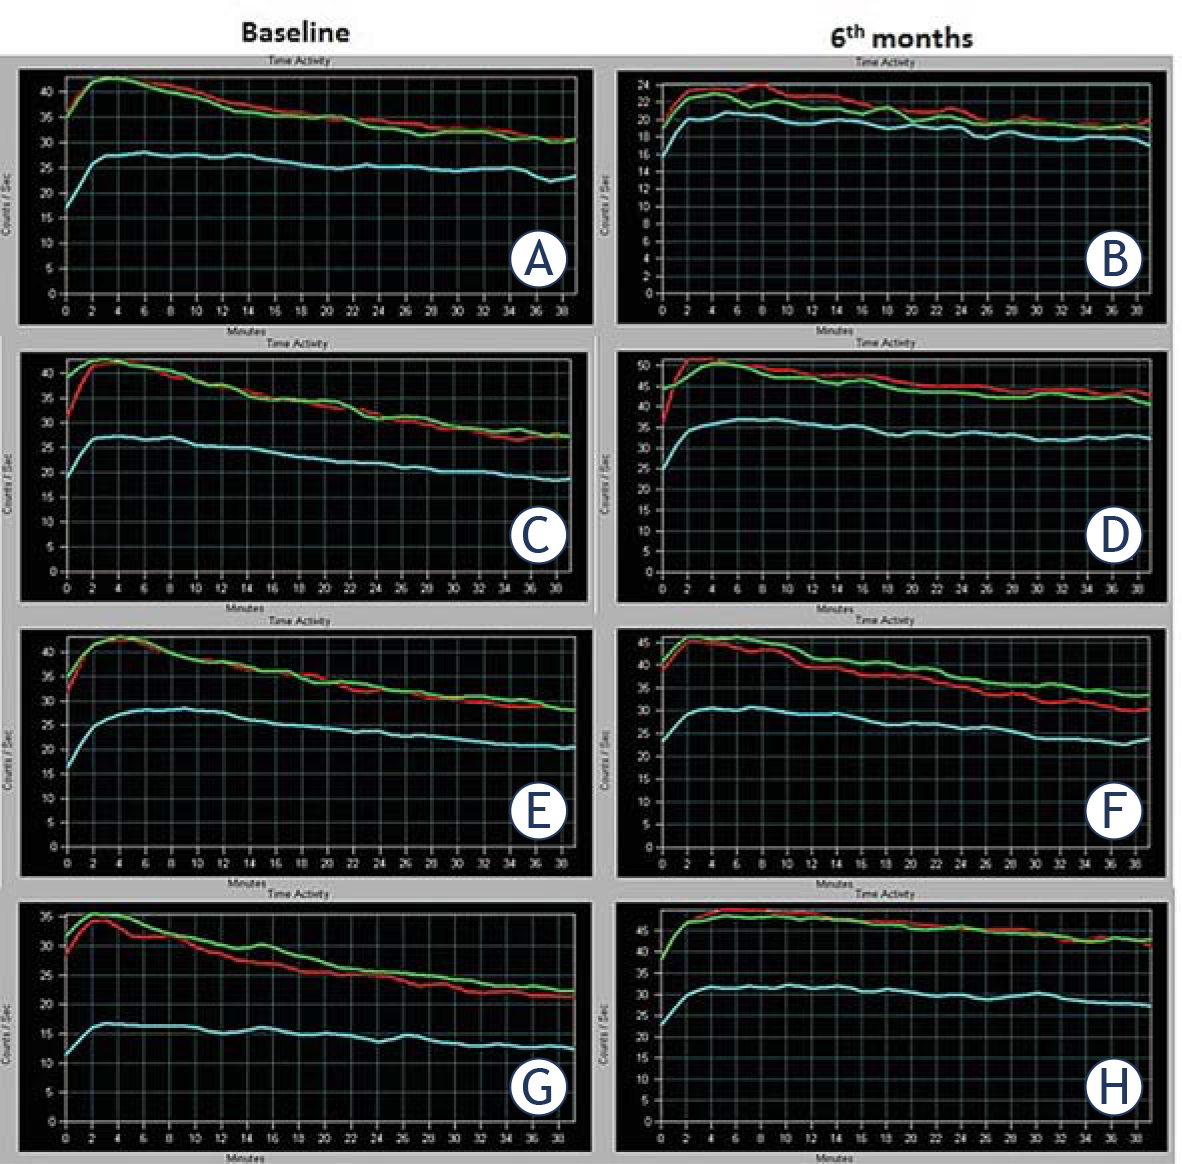
Figure 3
The figure represents functional data obtained from the time-activity curves of rats. A time-activity curve generated from dynamic scintigraphic data depicts the functional changing in activity of rat salivary glands over time. A baseline study (left side; A, C, E, G) and a six-month follow-up study (right side; B, D, F, H) on the rats was performed by 99mTc-pertecnetate salivary gland scintigraphy (2 mCi, 120 frames, 20 second per frame, 40 min). The functional differences between baseline and post-treatment status can be easily seen, and compared by time-activity curves. Definitions on a time-activity curve in this figure are as follows: x axis; examination time (minutes), y axis; count data (counts/second), purple line; left salivary gland activity curve, blue line; right salivary gland activity curve and red line; background tissue activity curve. (A and B). A significant deterioration in function over time with decreased gland uptake and secretion capability with only radioiodine administration (Group 1) is seen. (C to H). Radioiodine plus concomitant amifostine (Group 4; C and D), radioiodine plus concomitant (Groups 5; E and F) and after 48 h (Group 6; G and H) adipose tissue-derived mesenchymal stem cells administrations show mild to moderate deteriorations in function over time in terms of slope of the curve and secretion capability of the gland.