
TABLE 1
Standard dynamic contrast-enhanced magnetic resonance imaging (DCE-MRI) protocol for axial-plane images for T1-weighted FLASH 3D precontrast and five postcontrast series
| T2- | T2- | T1- | T1- | |
|---|---|---|---|---|
| weighted | weighted | weighted | weighted | |
| MRI sequence/ parameters | TIRM | TSE | TSE | FLASH 3D |
| Echo time (ms) | 60 | 70 | 12 | 4.8 |
| Repetition time (ms) | 7690 | 5900 | 910 | 9.1 |
| Inversion time (ms) | 180 | |||
| Flip angle (°) | 150 | 180 | 90 | 25 |
| Field of view (mm×mm) | 340×340 | 340×340 | 340×340 | 340×340 |
| Image matrix | 320×256 | 384×319 | 320×234 | 576×564 |
3D = three-dimensional; DCE-MRI = dynamic contrast-enhanced magnetic resonance imaging; FLASH = fast low-angle shot pulse sequence; TIRM = turbo inversion recovery magnitude; TSE = turbo spin-echo
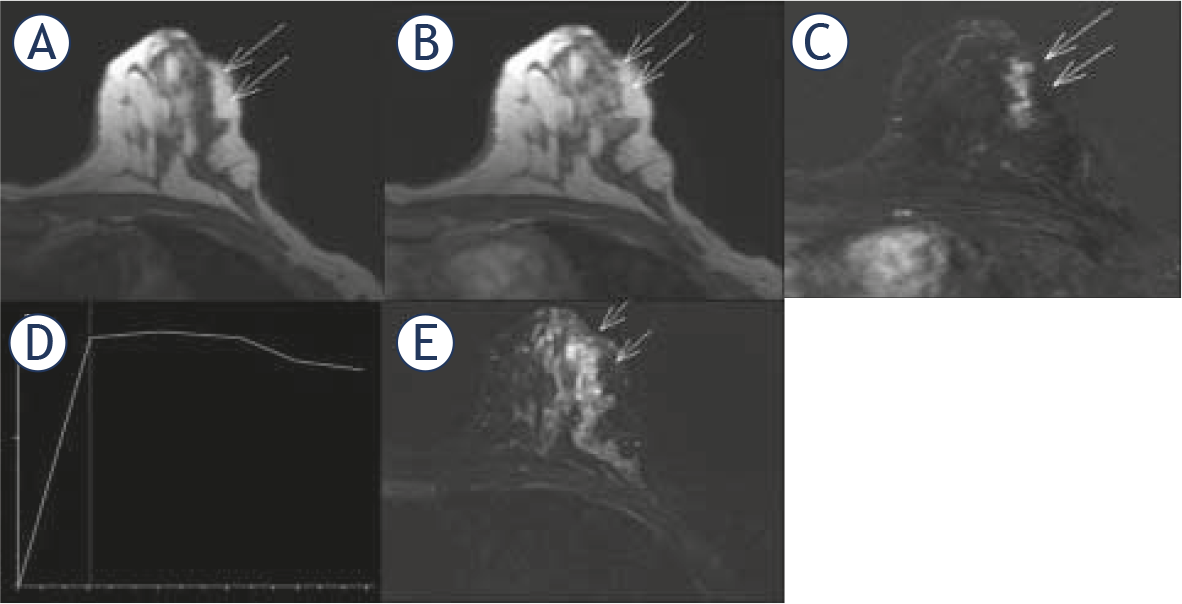
DCE-MRI findings of proliferative fibrocystic changes. Axial T1-weighted images, precontrast image (A) and contrast-enhanced image 1 min 23 s after administration of gadolinium (B) with corresponding subtraction image (C), show the segmental, non-mass enhancement (long arrows), measured 2.5×1×2.5 cm, with clumped internal pattern of enhancement. Time-intensity curve is plateau (type 2) with fast wash-in (D) Turbo inversion recovery magnitude (TIRM) sequence (E) show clustered microcysts (short arrows).
TABLE 2
Nonproliferative lesion, proliferative lesions without atypia and proliferative lesions with atypia: dynamic contrast-enhanced magnetic resonance imaging (DCE-MRI) morphological and enhancement kinetics features, based on BI-RADS lexicon
| Statistical difference | Proliferative lesions without atypia (N = 6) | Proliferative lesions with atypia (N = 29) | Non proliferative lesions (N = 11) | The DCE-MRI features of fibrocystic change | |
|---|---|---|---|---|---|
| p = 0.454 | 1 | 1 | 1 | 0.5 < d < 1 cm | Size |
| 5 | 28 | 10 | d ≥ 1cm | ||
| p = 0.168 | 3 | 7 | 1 | Segmental | NME distribution |
| 3 | 22 | 10 | Regional or diffuse | ||
| p = 0.722 | 0 | 2 | 0 | Homogeneous | NME internal enhancement |
| 1 | 4 | 3 | Stippled | ||
| 5 | 23 | 8 | Heterogeneous or clumped | ||
| p = 0.097 | 3 | 8 | 6 | Persistent | TIC |
| 3 | 19 | 3 | Plateau | ||
| 0 | 2 | 2 | Wash out | ||
| p = 0.752 | 2 | 8 | 5 | Slow | Wash-in |
| 1 | 10 | 3 | Moderate | ||
| 3 | 11 | 3 | Fast | ||
| p = 0.014 | 1 | 18 | 2 | Present | Microcysts (T2W images) |
| 5 | 11 | 9 | Absent | ||
d = longest diameter; DCE-MRI = dynamic contrast-enhanced magnetic resonance imaging; NME = non-mass enhancement; TIC = time-intensity curve; T2W = T2-weighted