
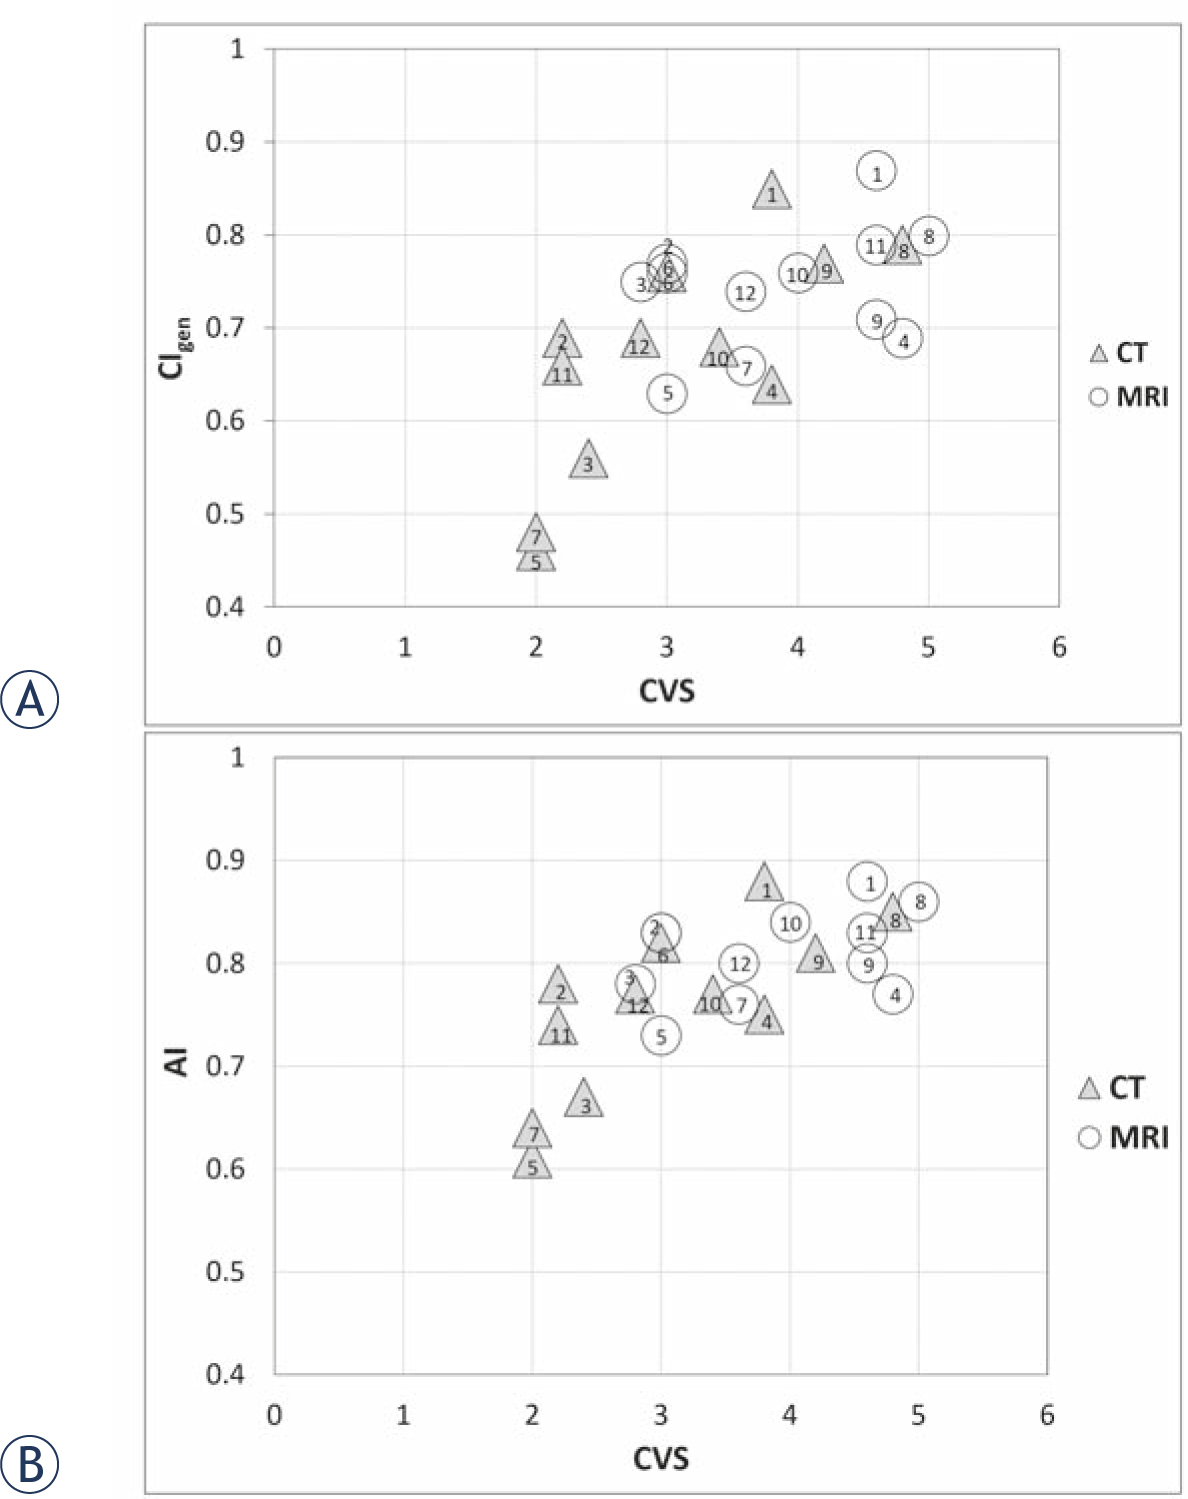
(A) Generalized conformity index (CIgen) and (B) accuracy index (AI) as a function of the cavity visualization score (CVS) for CT and MRI based contouring of lumpectomy cavity clinical target volume. None of the patients had surgical clips inserted in the tumor bed. Case numbers are indicated for each modality.
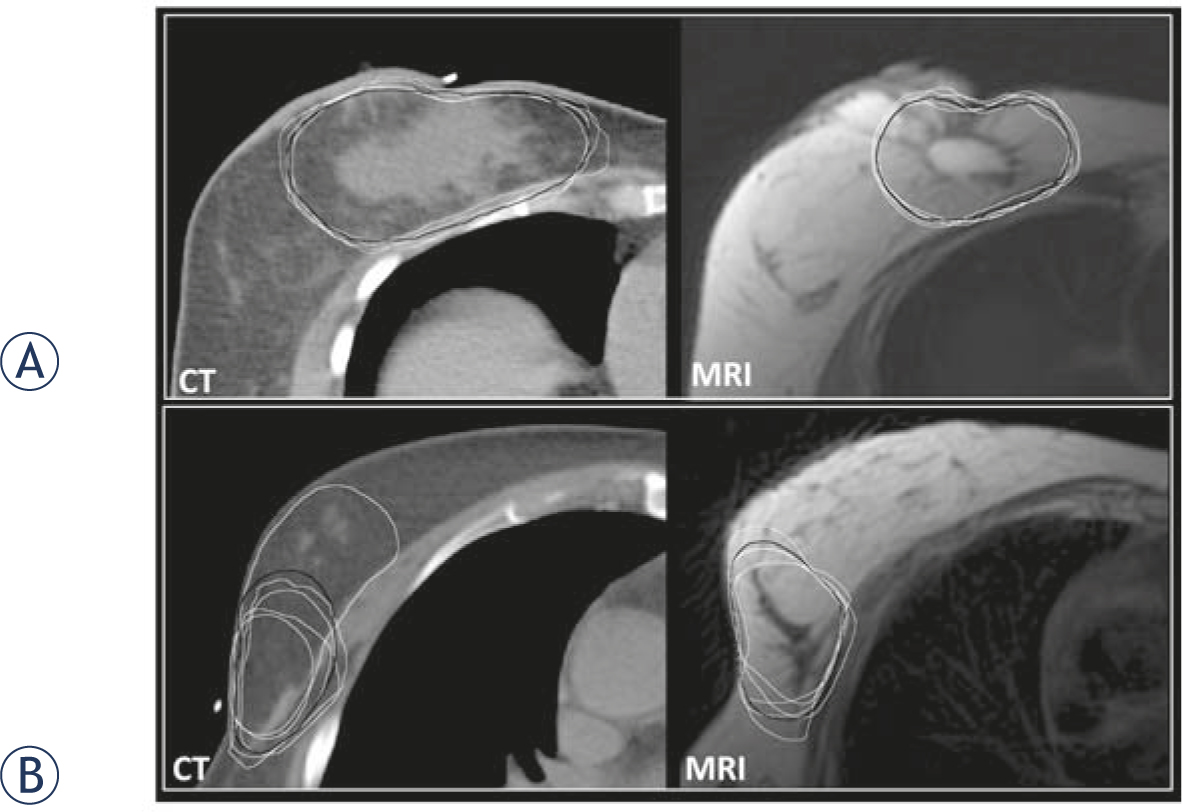
CT and MRI based contouring in two examples with high and low cavity visualization scores (CVS). Observers’ delineations are white and expert consensus (EC) contours black. (A) Case with a CVS of 4.8 on CT and 5 on MRI: mean generalized conformity index (CIgen), accuracy index (AI) and inter-delineation distance (IDD) were 0.79, 0.85 and 2.4 mm on CT and 0.80, 0.86 and 2.2 mm on MRI. (B) Case with a CVS of 2 on CT and 3 on MRI: mean CIgen, AI and IDD were 0.46, 0.61 and 6 mm for CT and 0.63, 0.73 and 4.5 mm for MRI.
Table 1
Results for inter-observer variation in contouring. The difference in mean generalized conformity index (CIgen) between the CT and MRI based contouring was statistically significant (p = 0.007)
| Case | CT | MRI | ||||
|---|---|---|---|---|---|---|
| Mean V [cm3] (SD) | CoV [%] | CIgen | Mean V [cm3] (SD) | CoV [%] | CIgen | |
| 1 | 198 (10) | 5 | 0.85 | 106 (4) | 4 | 0.87 |
| 2 | 241 (37.5) | 16 | 0.69 | 256 (28) | 11 | 0.77 |
| 3 | 108 (20.7) | 19 | 0.56 | 125 (10) | 8 | 0.75 |
| 4 | 75 (18.1) | 24 | 0.64 | 92 (12) | 13 | 0.69 |
| 5 | 175 (47.9) | 27 | 0.46 | 217 (68) | 31 | 0.63 |
| 6 | 140 (10.1) | 7 | 0.76 | 125 (14) | 11 | 0.76 |
| 7 | 103(39.7) | 39 | 0.48 | 64 (2) | 4 | 0.66 |
| 8 | 180 (22.5) | 12 | 0.79 | 158 (14) | 9 | 0.8 |
| 9 | 135 (19.8) | 15 | 0.77 | 126 (20) | 16 | 0.71 |
| 10 | 204 (44.3) | 22 | 0.68 | 215 (19) | 9 | 0.76 |
| 11 | 99 (14.4) | 15 | 0.66 | 135 (11) | 8 | 0.79 |
| 12 | 195 (27.3) | 14 | 0.69 | 210 (29) | 14 | 0.74 |
| MEAN (SD) | 154 (26) | 18 | 0.67 (0.12) | 152 (19) | 12 | 0.74 (0.07) |
CoV = Coefficient of Variance; CTVLC = Clinical Target Volume of Lumpectomy Cavity; SD = Standard Deviation
Table 2
Accuracy index (AI) and inter-delineation distances (IDD), based on the expert consensus (EC) delineation as the reference. The differences in AI and IDD between CT and MRI were statistically significant (p < 0.05)
| CT | MRI | |||||||||||
|---|---|---|---|---|---|---|---|---|---|---|---|---|
| Case | ||||||||||||
| IDD [mm] | AI | IDD [mm] | AI | |||||||||
| Mean | SD | CoV [%] | Mean | SD | CoV [%] | Mean | (SD) | CoV [%] | Mean | SD | CoV [%] | |
| 1 | 2.1 | 0.8 | 38 | 0.88 | 0.02 | 3 | 1.8 | 0.58 | 32 | 0.88 | 0.01 | 2 |
| 2 | 3.6 | 1.9 | 53 | 0.78 | 0.1 | 12 | 3.2 | 1.9 | 59 | 0.83 | 0.02 | 3 |
| 3 | 3.9 | 2.6 | 67 | 0.67 | 0.07 | 10 | 3.2 | 1.8 | 56 | 0.78 | 0.02 | 2 |
| 4 | 2.3 | 1 | 43 | 0.75 | 0.06 | 8 | 2.3 | 0.9 | 39 | 0.77 | 0.05 | 6 |
| 5 | 6 | 4 | 67 | 0.61 | 0.15 | 24 | 4.5 | 2.1 | 47 | 0.73 | 0.14 | 20 |
| 6 | 2.6 | 1.1 | 42 | 0.82 | 0.02 | 2 | 2.6 | 1 | 38 | 0.83 | 0.02 | 2 |
| 7 | 6 | 4.1 | 68 | 0.64 | 0.09 | 14 | 3.6 | 1.8 | 50 | 0.76 | 0.05 | 7 |
| 8 | 2.4 | 1.2 | 50 | 0.85 | 0.02 | 2 | 2.2 | 1 | 45 | 0.86 | 0.04 | 4 |
| 9 | 3 | 2.9 | 97 | 0.81 | 0.04 | 5 | 2.9 | 1.8 | 62 | 0.80 | 0.05 | 6 |
| 10 | 4.5 | 3.5 | 78 | 0.77 | 0.07 | 9 | 3.3 | 2 | 61 | 0.84 | 0.02 | 2 |
| 11 | 3.3 | 2 | 61 | 0.74 | 0.09 | 12 | 2.5 | 1.3 | 52 | 0.83 | 0.02 | 3 |
| 12 | 3.4 | 2.3 | 68 | 0.77 | 0.06 | 8 | 3.6 | 1.7 | 47 | 0.80 | 0.02 | 2 |
| MEAN | 3.6 | 2.3 | 61 | 0.76 | 0.07 | 9 | 3 | 1.5 | 49 | 0.81 | 0.04 | 5 |
CoV = Coefficient of Variance; CTVLC = Clinical Target Volume of Lumpectomy Cavity; SD = Standard Deviation