
Table 1
Response of B16F10 melanoma to different treatment modalities
| Therapeutic group | DT (days) | TGD (days) | TF | SC | |||||||
|---|---|---|---|---|---|---|---|---|---|---|---|
| n | AM | SEM | AM | SEM | n | % | n | % | |||
| CTRL | 8 | 1.2 | ± | 0.1 | 0.0 | ± | 0.1 | 0 | 0 | - | - |
| pControl | 8 | 1.9 | ± | 0.2 | 0.7 | ± | 0.2 | 0 | 0 | - | - |
| TS | 8 | 2.2 | ± | 0.3 | 1.0 | ± | 0.3 | 0 | 0 | - | - |
| 3 × EP | 8 | 3.1 | ± | 0.3 | 2.0 | ± | 0.3 | 0 | 0 | - | - |
| 3 × GET (pControl) | 8 | 9.4 | ± | 6.5 | 8.2 | ± | 2.5 | 0 | 0 | - | - |
| 3 × GET (TS) | 9 | 9.5 | ± | 3.2 | 8.6 | ± | 3.0 | 4 | 44 | 3 | 75 |
| IR | 9 | 1.8 | ± | 0.3 | 0.7 | ± | 0.3 | 0 | 0 | - | - |
| pControl + IR | 9 | 2.5 | ± | 0.3 | 1.3 | ± | 0.3 | 1 | 11 | 1 | 100 |
| TS + IR | 8 | 4.0 | ± | 1.2 | 2.8 | ± | 1.2 | 0 | 0 | - | - |
| 3 × EP+IR | 9 | 4.3 | ± | 1.3 | 3.2 | ± | 1.3 | 2 | 22 | 0 | 0 |
| 3 × GET (pControl) + IR | 9 | 36.0 | ± | n/a | 34.9 | ± | n/a | 8 | 89 | 5 | 63 |
| 3 × GET (TS) + IR | 8 | 32.0 | ± | n/a | 30.8 | ± | n/a | 7 | 88 | 4 | 57 |
AM = Arithmetic mean; DT = Tumor doubling time; Groups: (CTRL = control; EP = electric pulses; GET = gene electrotransfer; IR = irradiation; TS = pETantiCD105); n = Number of all mice in the group; n/a = Not applicable; SC = Mice resistant to secondary challenge; SEM = Standard error; TF = Tumor free mice; TGD = Tumor growth delay
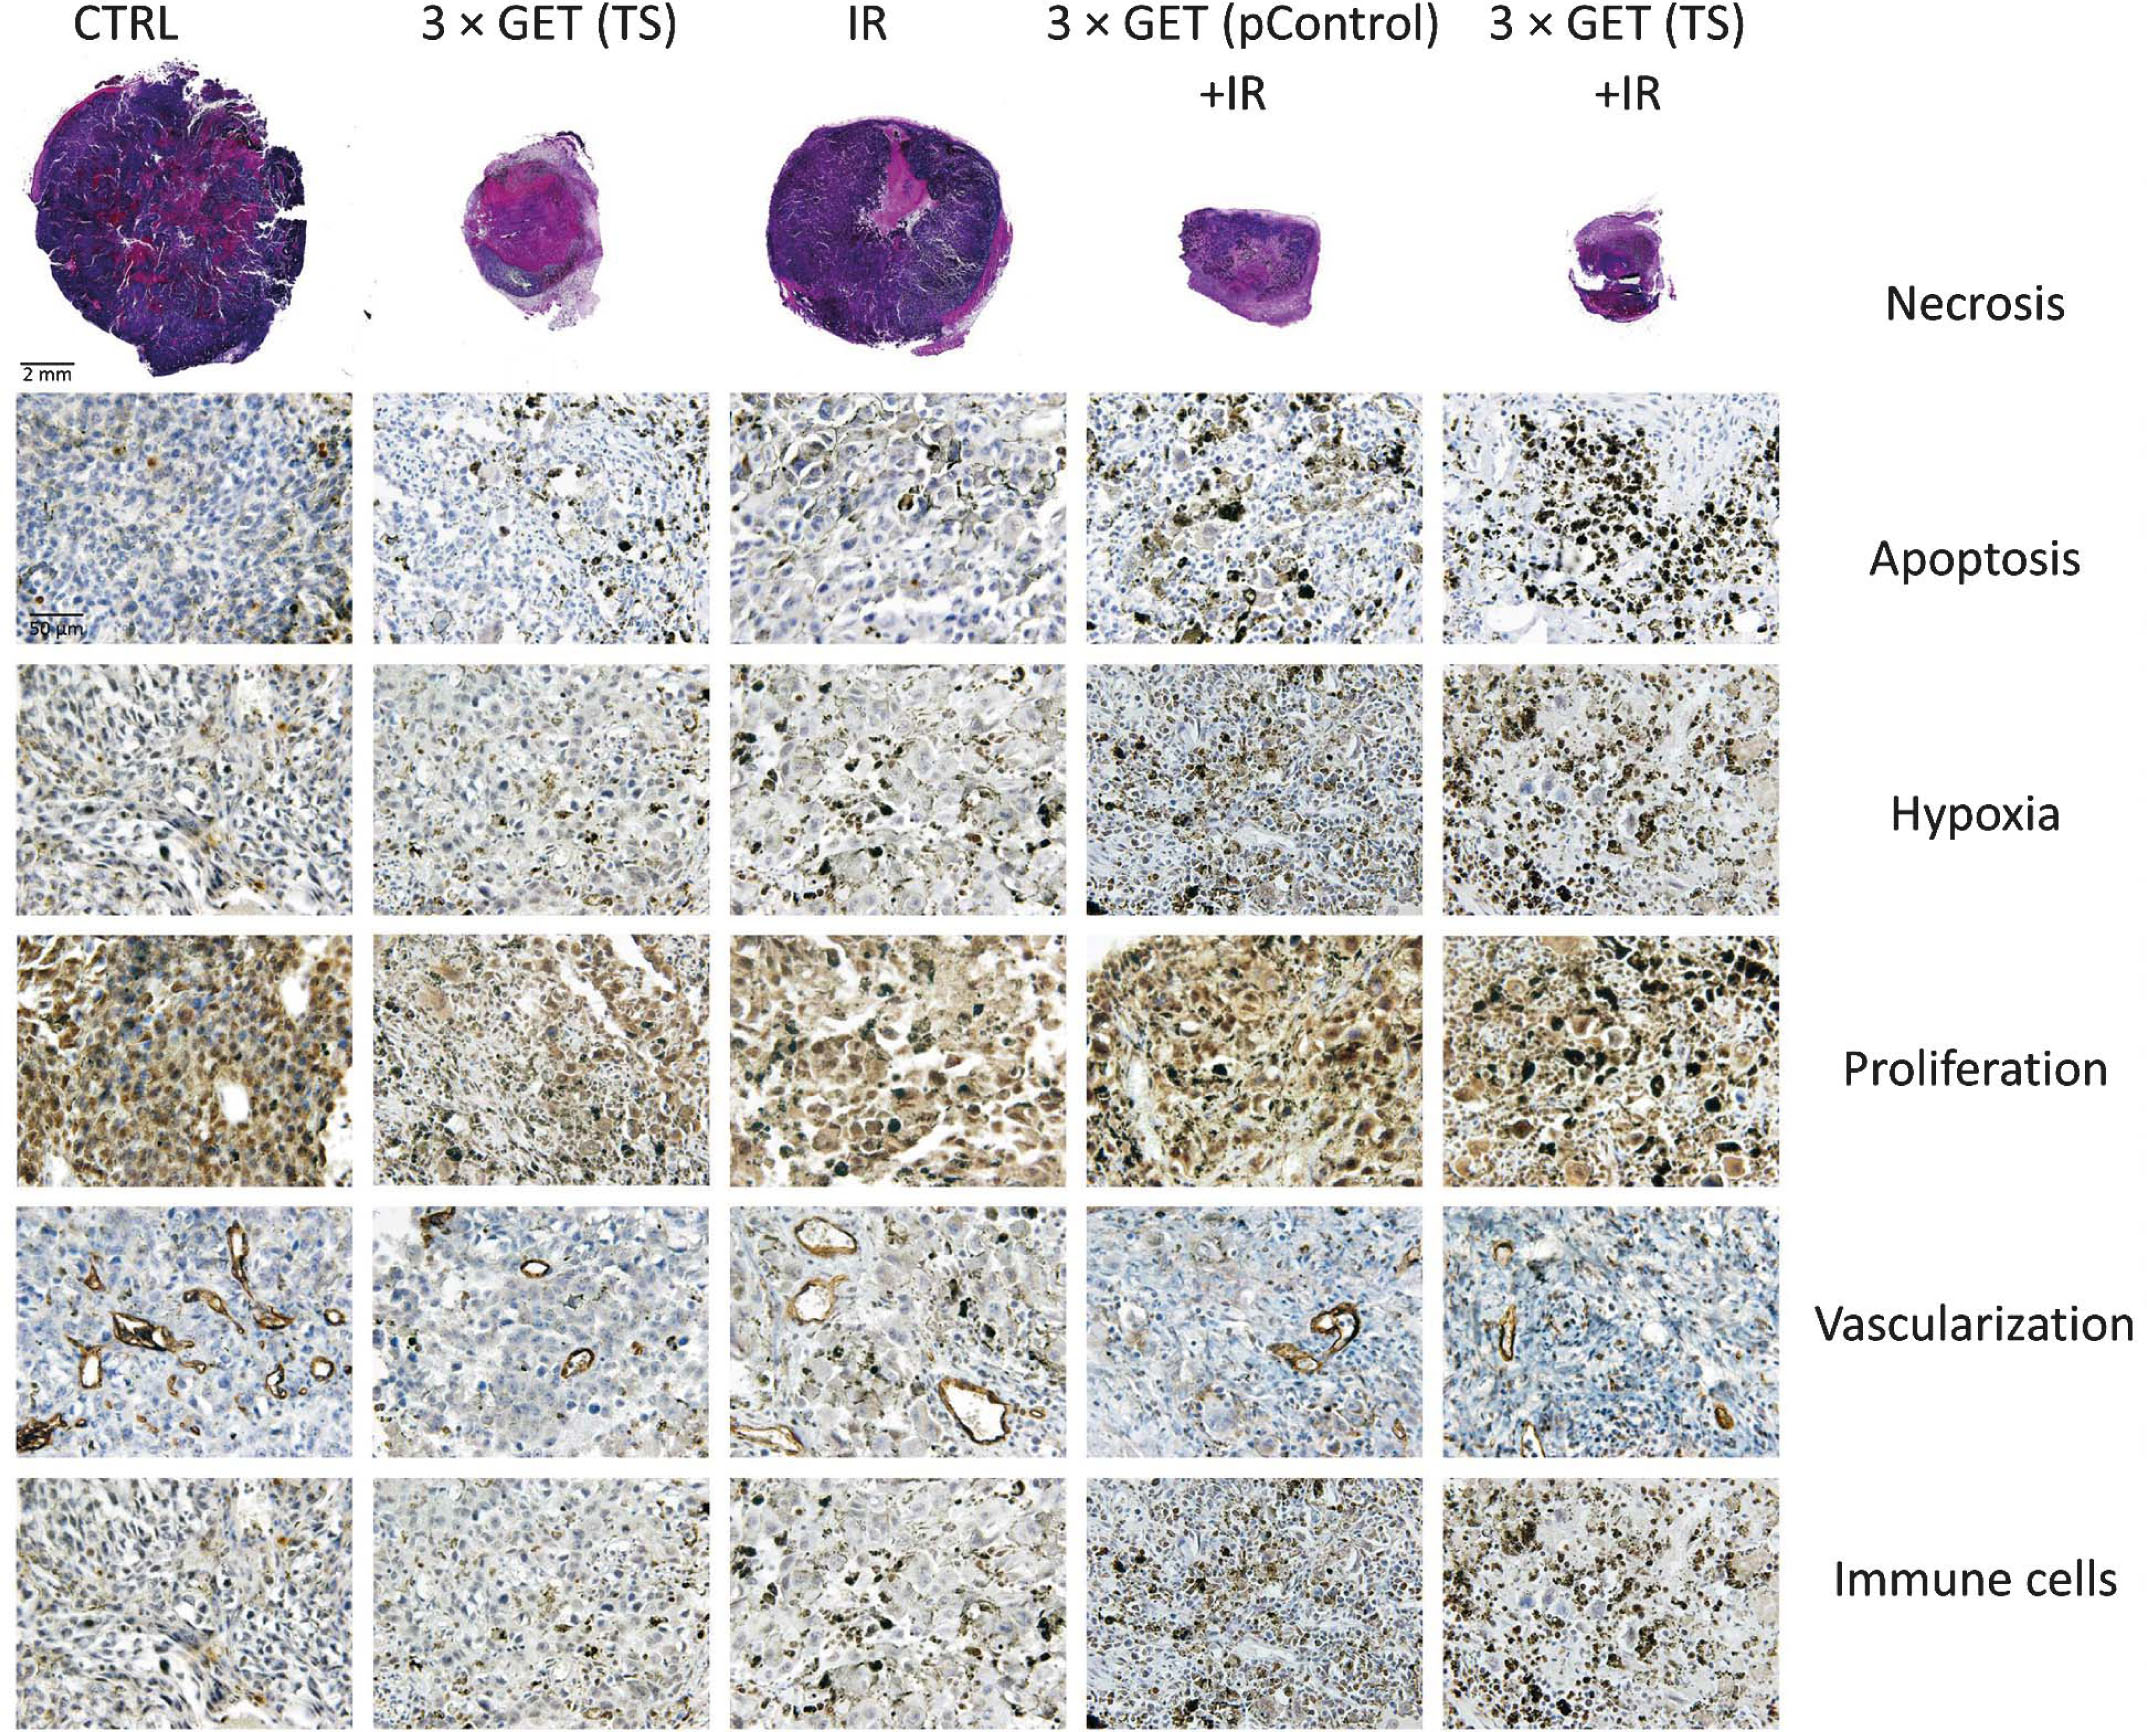
Histological sections of melanoma tumors on day 6 after the beginning of the therapy.
CTRL = control; EP = electric pulses; GET = gene electrotransfer; IR = irradiation; TS = pET-antiCD105
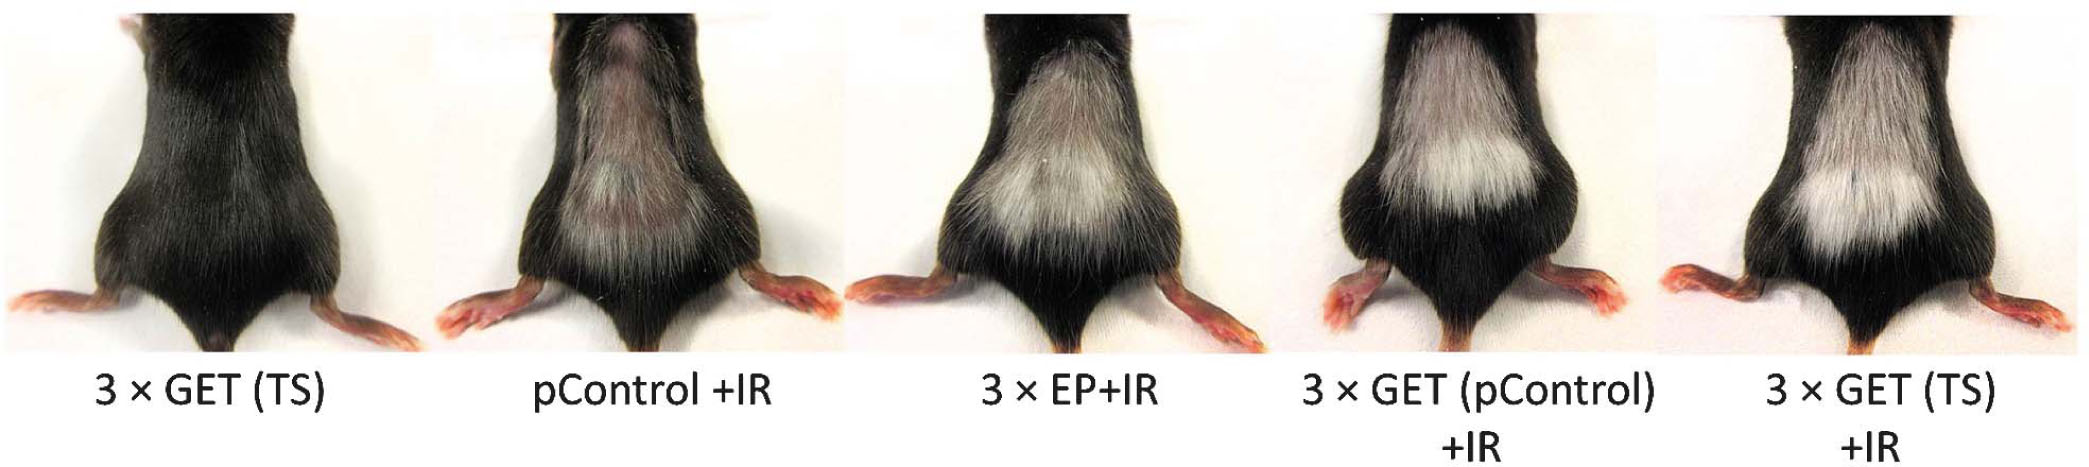
Immune response of melanoma tumors is observed by vitiligo effect.
CTRL = control; EP = electric pulses; GET = gene electrotransfer; IR = irradiation; TS = pET-antiCD105
Table 2
Immunohistological analysis of tumors
| Therapeutic group | Necrosis (%) | Apoptosis (%) | Hypoxia (%) | Proliferation (%) | Vascularization (n of structures) | Immune cells (n of cells) | ||||||||||||
|---|---|---|---|---|---|---|---|---|---|---|---|---|---|---|---|---|---|---|
| AM | SEM | AM | SEM | AM | SEM | AM | SEM | AM | SEM | AM | SEM | |||||||
| CTRL | 25.0 | ± | 2.6 | 11.3 | ± | 1.6 | 4.7 | ± | 1.0 | 92.2 | ± | 1.3 | 51.6 | ± | 3.2 | 7.9 | ± | 0.9 |
| pControl | 20.0 | ± | 2.6 | 11.6 | ± | 1.0 | 5.4 | ± | 1.0 | 92.1 | ± | 1.2 | 47.1 | ± | 4.7 | 8.3 | ± | 1.1 |
| TS | 21.7 | ± | 2.6 | 11.4 | ± | 1.5 | 5.5 | ± | 0.7 | 92.7 | ± | 1.0 | 50.5 | ± | 4.2 | 7.9 | ± | 0.7 |
| 3 × EP | 13.3 | ± | 3.6 | 18.7 | ± | 2.7 | 7.8 | ± | 0.8 | 74.4 | ± | 1.7 | 39.9 | ± | 2.6 | 14.3 | ± | 1.7 |
| 3 × GET (pControl) | 53.3 | ± | 7.9 | 19.5 | ± | 3.0 | 15.3 | ± | 2.9 | 75.6 | ± | 2.4 | 35.3 | ± | 4.2 | 15.1 | ± | 1.6 |
| 3 × GET (TS) | 65.8 | ± | 7.6 | 26.7 | ± | 2.2 | 46.3 | ± | 3.0 | 49.5 | ± | 3.8 | 14.9 | ± | 1.1 | 19.3 | ± | 1.7 |
| IR | 21.7 | ± | 4.2 | 18.4 | ± | 1.8 | 30.2 | ± | 2.4 | 53.3 | ± | 3.5 | 30.1 | ± | 2.3 | 26.8 | ± | 2.6 |
| pControl + IR | 37.5 | ± | 8.0 | 18.7 | ± | 1.9 | 32.3 | ± | 2.5 | 54.5 | ± | 4.7 | 24.5 | ± | 1.8 | 26.4 | ± | 2.1 |
| TS + IR | 43.3 | ± | 8.0 | 19.9 | ± | 1.5 | 31.6 | ± | 2.3 | 52.0 | ± | 2.9 | 23.8 | ± | 1.6 | 26.4 | ± | 2.3 |
| 3 × EP + IR | 25.0 | ± | 4.8 | 31.0 | ± | 2.0 | 51.7 | ± | 2.6 | 59.4 | ± | 4.0 | 28.9 | ± | 2.3 | 29.3 | ± | 2.1 |
| 3 × GET (pControl) + IR | 65.0 | ± | 7.6 | 38.7 | ± | 3.1 | 58.0 | ± | 2.8 | 46.0 | ± | 4.8 | 18.9 | ± | 2.0 | 45.8 | ± | 3.0 |
| 3 × GET (TS) + IR | 79.2 | ± | 4.2 | 50.3 | ± | 2.4 | 66.7 | ± | 1.6 | 46.7 | ± | 4.8 | 12.8 | ± | 1.0 | 46.5 | ± | 2.1 |
AM = Arithmetic mean; Groups: (CTRL = control; EP = electric pulses; GET = gene electrotransfer; IR = irradiation; TS = pET-antiCD105); n = Number of structures or cells; SEM = Standard error