
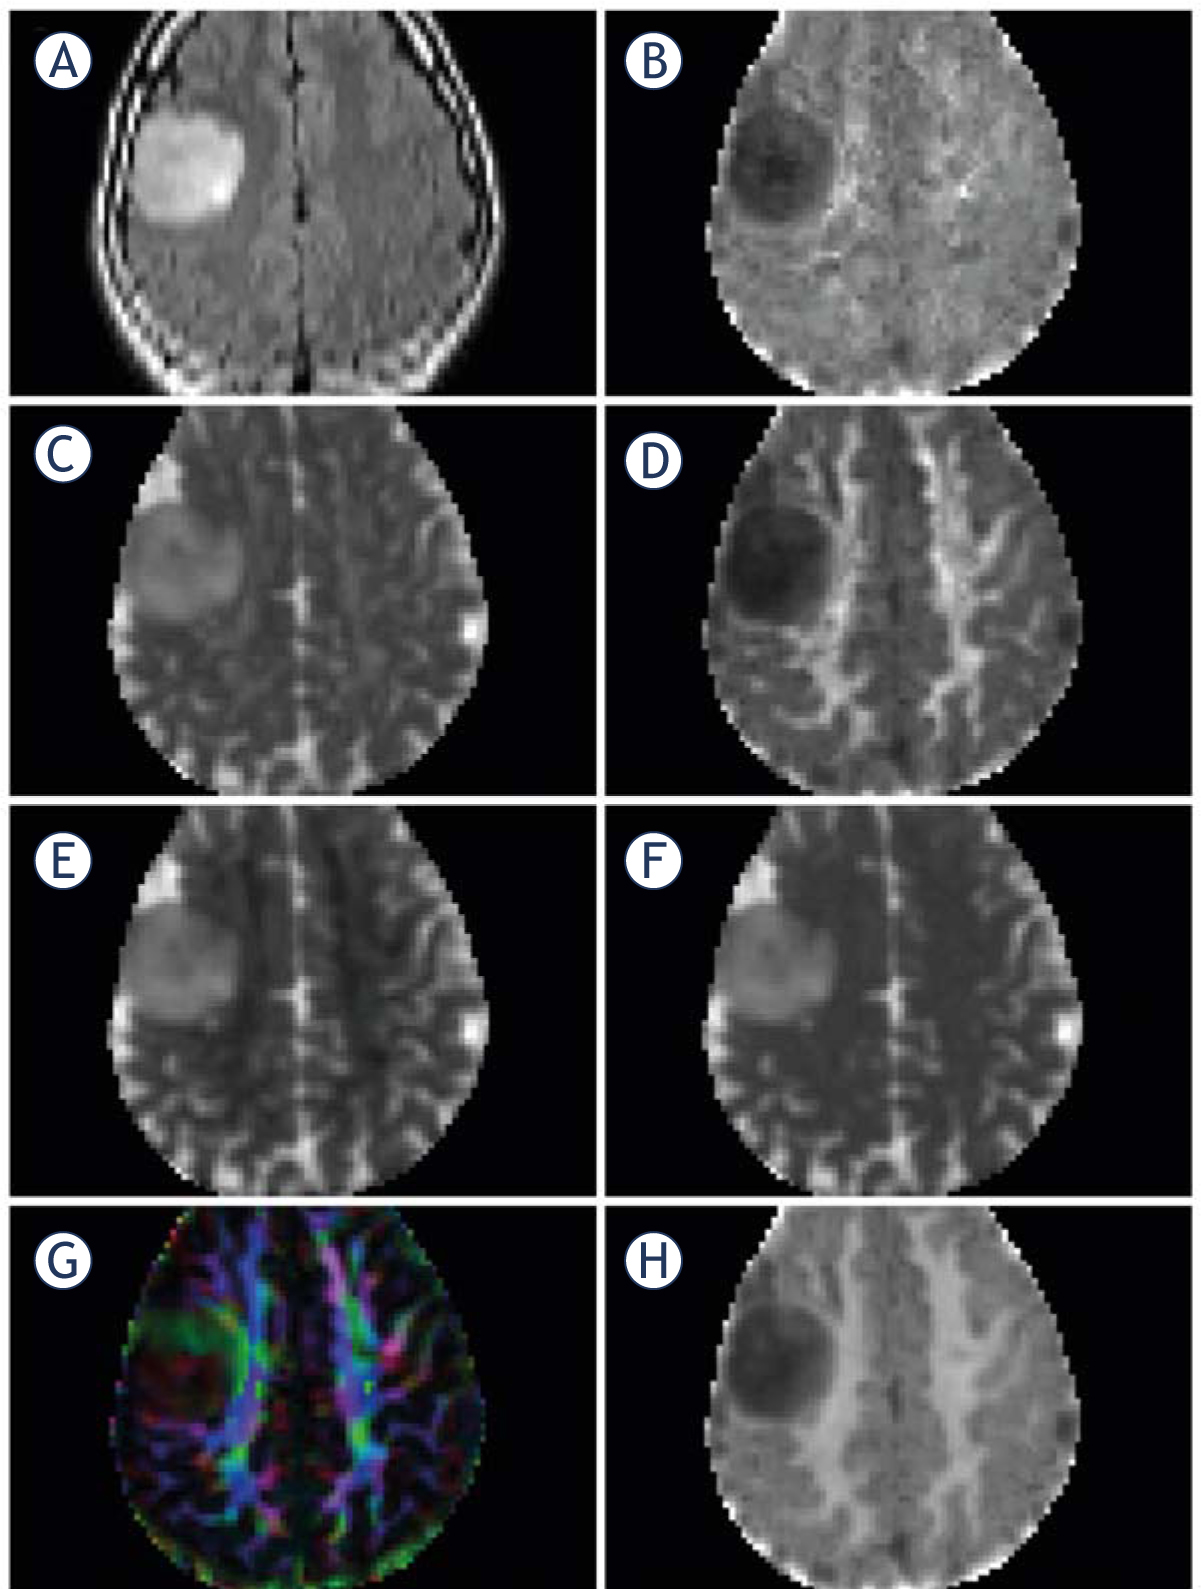
MRI in a patient with an oligodendroglioma grade II in the right frontal lobe, non-smoothed images. (A) T2FLAIR, (B) Axial Kurtosis, (C) Axial Diffusivity, (D) Radial Kurtosis, (E) Radial Diffusivity, (F) Mean Diffusivity, (G) Fractional Anisotropy, color coded, (H) Mean Kurtosis. Mean, axial and radial diffusivity 10-3 mm2/sec, fractional anisotropy, mean, axial and radial kurtosis and fractional anisotropy are dimensionless.
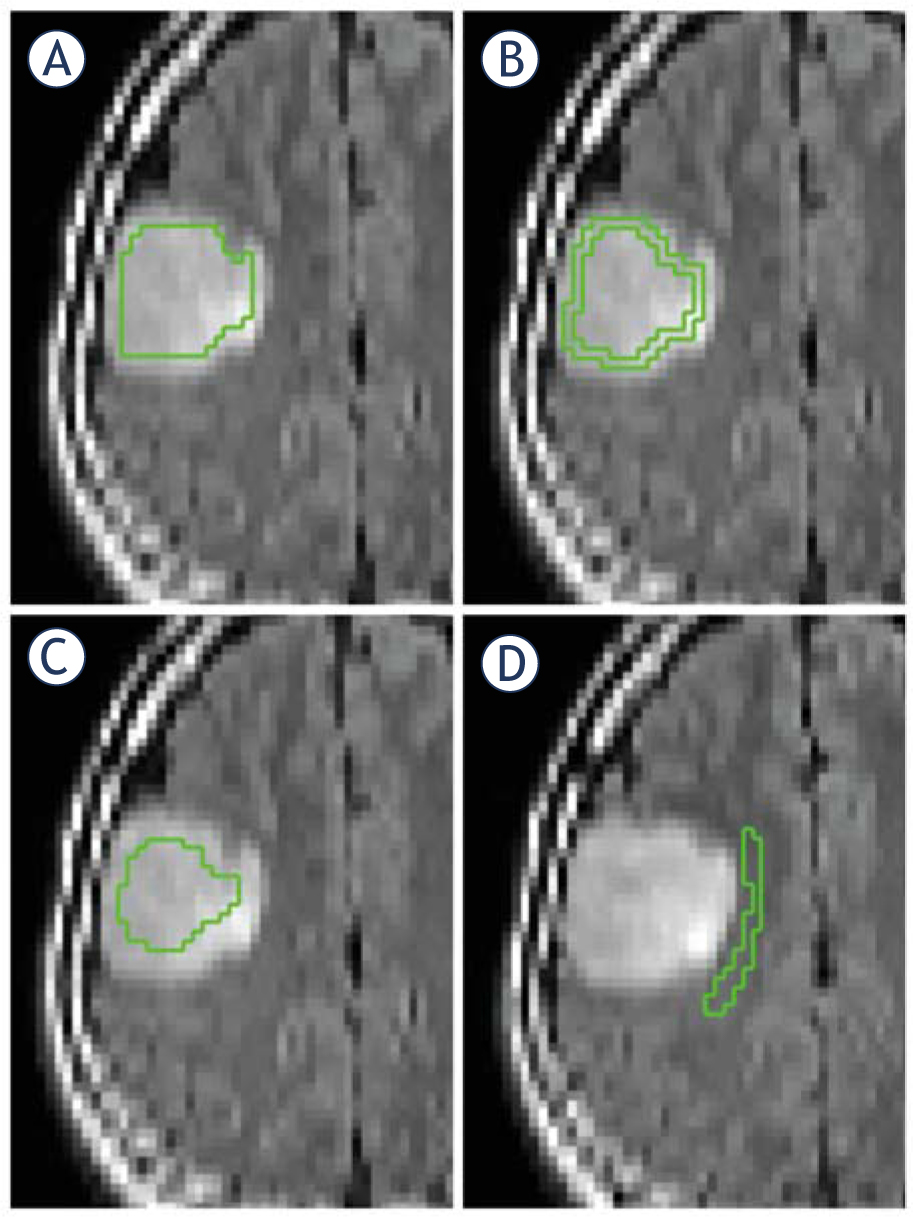
ROIs in a patient with an oligodendroglioma grade II. (A) Total tumor ROI. (B) Peripheral tumor ROI. (C) Central tumor ROI. (D) Perilesional ROI. All ROIs were drawn on non-smoothed images to increase the precision. ROI = region of interest
Table 1
Results from analysis of perilesional and contralesional normal-appearing white matter
| Diffusion histogram parameter | Perilesional NAWM | Contralesional NAWM | p |
|---|---|---|---|
| Mean (SD) (n = 35) | Mean (SD) (n = 35) | ||
| Axial diffusivity | 1.26 (0.14) | 1.38 (0.13) | 0.000182 |
| Radial diffusivity | 0.67 (0.10) | 0.53 (0.06) | 0.000001 |
| Fractional anisotropy | 0.40 (0.11) | 0.55 (0.09) | < 0.000000 |
| Axial kurtosis | 0.76 (0.07) | 0.73 (0.08) | 0.099422 |
| Radial kurtosis | 1.29 (0.24) | 1.63 (0.16) | < 0.000000 |
| Mean diffusivity | 0.87 (0.07) | 0.82 (0.04) | 0.000009 |
| Mean kurtosis | 0.95 (0.09) | 1.06 (0.05) | < 0.000000 |
Student’s t-test for dependent samples (normally distributed data) and Wilcoxon matched pairs test (non-normally distributed data). NAWM = Normal appearing white matter. Mean, axial and radial diffusivity 10-3 mm2/sec, fractional anisotropy, mean, axial and radial kurtosis and fractional anisotropy are dimensionless.
Table 2
Mean diffusion kurtosis imaging variables in tumor regions of interest (ROI) (mean (SD))
| Glioma subgroups | Grade II | Grade III | p | Astrocytoma | Oligodendroglioma | p |
|---|---|---|---|---|---|---|
| n = 23 | n = 12 | n = 18 | n = 17 | |||
| Axial diffusivity (mean (SD)) | 1.72 (0.19) | 1.81 (0.35) | 0.19 | 1.76 (0.28) | 1.74 (0.24) | 0.78 |
| Radial diffusivity (mean (SD)) | 1.44 (0.20) | 1.50 (0.34) | 0.52 | 1.47 (0.31) | 1.46 (0.17) | 0.71 |
| Fractional anisotropy (mean (SD)) | 0.12 (0.03) | 0.13 (0.04) | 0.22 | 0.13 (0.04) | 0.12 (0.03) | 0.10 |
| Axial kurtosis (mean (SD)) | 0.47 (0.08) | 0.48 (0.06) | 0.47 | 0.46 (0.06) | 0.49 (0.08) | 0.68 |
| Radial kurtosis (mean (SD)) | 0.53 (0.09) | 0.53 (0.08) | 0.77 | 0.52 (0.09) | 0.54 (0.09) | 0.54 |
| Mean diffusivity (mean (SD)) | 1.54 (0.19) | 1.60 (0.34) | 0.71 | 1.56 (0.30) | 1.55 (0.19) | 0.96 |
| Mean kurtosis (mean (SD)) | 0.50 (0.08) | 0.50 (0.07) | 0.50 | 0.49 (0.07) | 0.51 (0.09) | 0.66 |
All values are expressed as ratios normalized against contralateral normal appearing white matter. Mean, axial and radial diffusivity 10-3 mm2/sec, fractional anisotropy, mean, axial and radial kurtosis and fractional anisotropy are dimensionless.
Table 3
Results from multiple comparison test and receiver operating characteristics curves in groups and subgroups of gliomas
| p | AUC | |
|---|---|---|
| Discrimination between glioma grades II (n = 23) and III (n = 12) | ||
| The kurtosis of radial kurtosis in peripheral tumor ROI | 0.0025 | 0.8152 |
| Discrimination between astrocytoma grades II (n = 10) and III (n = 8) | ||
| The skewness of radial kurtosis in peripheral tumor ROI | 0.0034 | 0.8116 |
| Discrimination between oligodendroglioma grades II (n = 13) and III (n = 4) | ||
| The peak height of fractional anisotropy in peripheral tumor ROI | 0.0066 | 0.7391 |
| Discrimination between glioma types astrocytomas (n = 18) and oligodendrogliomas (n = 17) | ||
| The skewness of mean diffusivity in central tumor ROI | 0.0191 | 0.7320 |
| Discrimination between glioma types astrocytomas grade II (n = 10) and oligodendrogliomas grade II (n = 13) | ||
| The peak height of mean diffusivity in central tumor ROI | 0.0110 | 0.6601 |
| Discrimination between glioma types astrocytomas grade III (n = 8) and oligodendrogliomas grade III (n = 4) | ||
| The kurtosis of mean diffusivity in perilesion ROI | 0.0174 | 0.6569 |
Multiple comparison of mean ranks between groups of glioma grades and types of gliomas with Dunn’s correction for multiple comparisons. AUC = area under the curve. ROI = region of interest. All values are expressed as ratios normalized against contralateral normal appearing white matter.
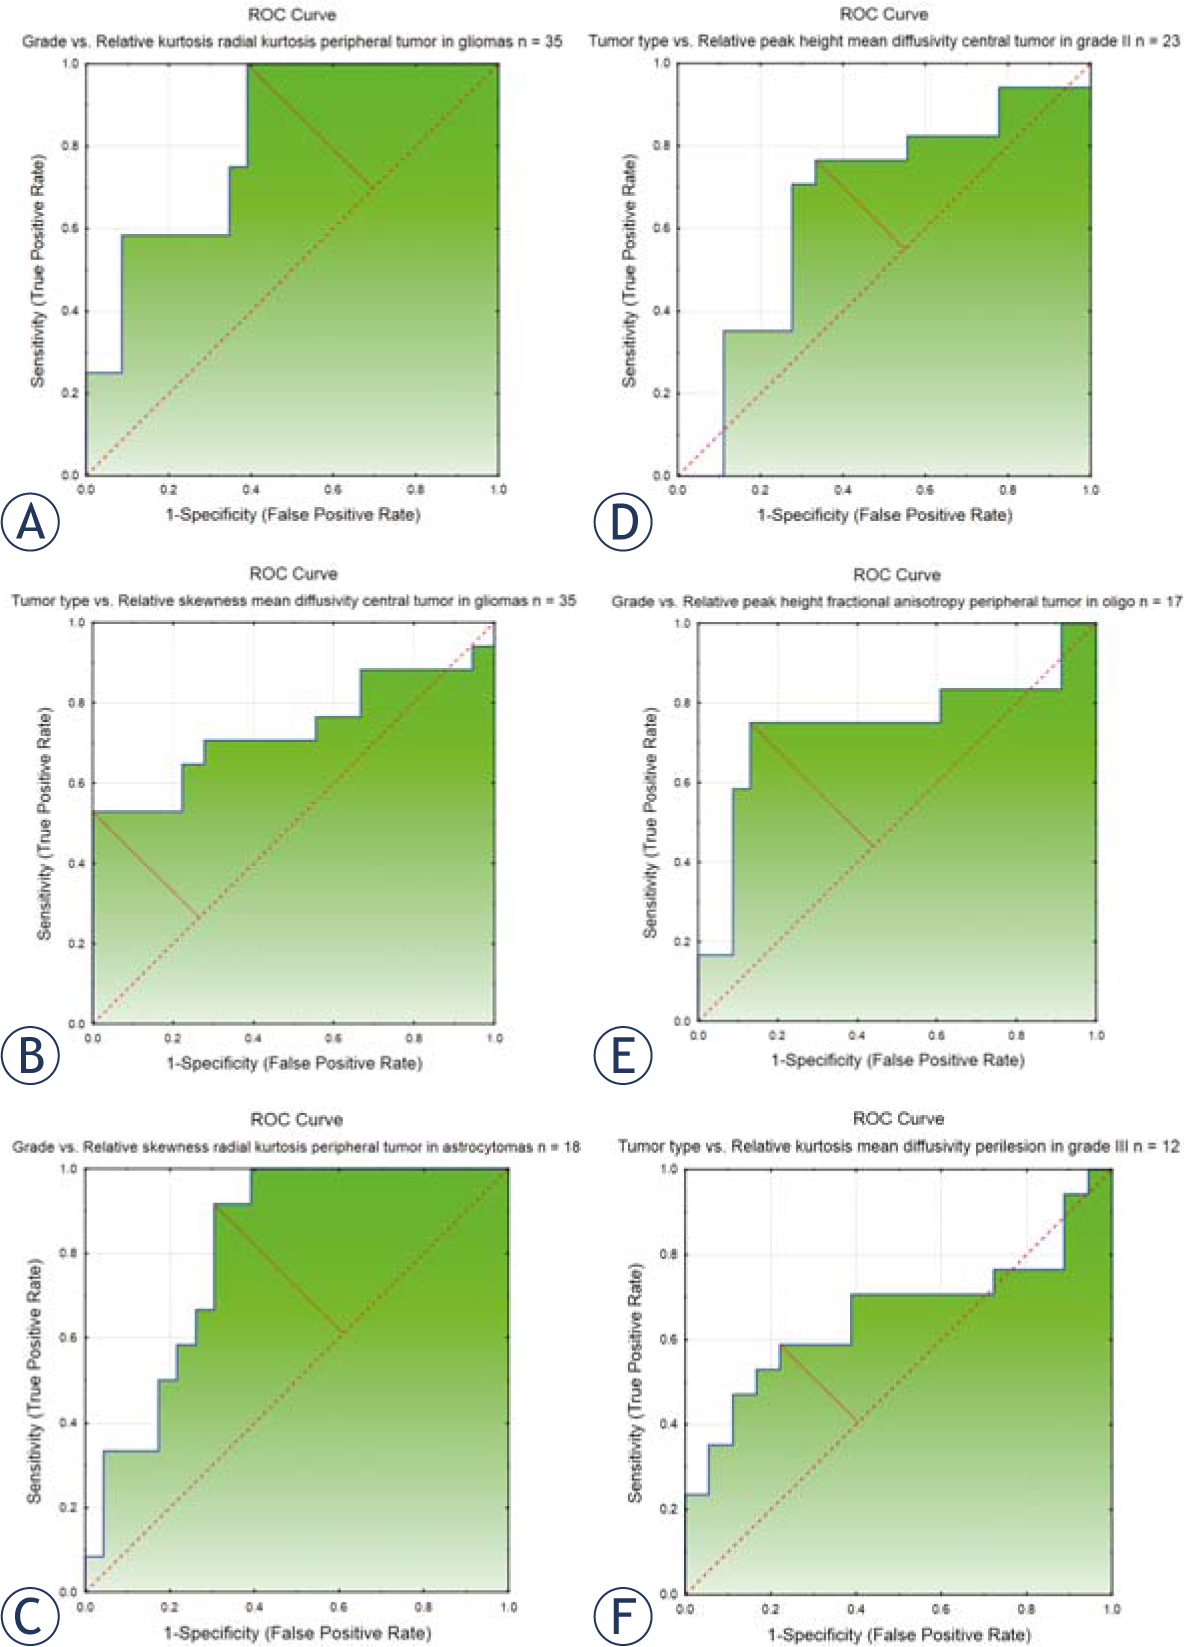
ROC curves presenting the best discriminating relative DKI histogram variables between glioma grades (II and III) and subtypes (astrocytomas and oligodendrogliomas). (A) Discrimination between glioma grades II and III with the kurtosis of radial kurtosis in peripheral tumor ROI, AUC = 0.815. (B) Discrimination between glioma subtypes astrocytoma and oligodendroglioma with the skewness of mean diffusivity in central tumor ROI, AUC = 0.732. (C) Discrimination between glioma grades II and III in astrocytomas with the skewness of radial kurtosis in peripheral tumor ROI, AUC = 0.812. (D) Discrimination between glioma subtypes astrocytoma and oligodendroglioma in gliomas grade II with the peak height of mean diffusivity in central tumor ROI, AUC = 0.660. (E) Discrimination between glioma grades II and III in oligodendrogliomas, with the peak height of fractional anisotropy in peripheral tumor ROI, AUC = 0.739. (F) Discrimination between glioma subtypes astrocytoma and oligodendroglioma in gliomas grade III with the kurtosis of mean diffusivity in perilesional ROI, AUC = 0.657.
AUC = area under the curve; ROC = receiver operating characteristic; ROI = region of interest