
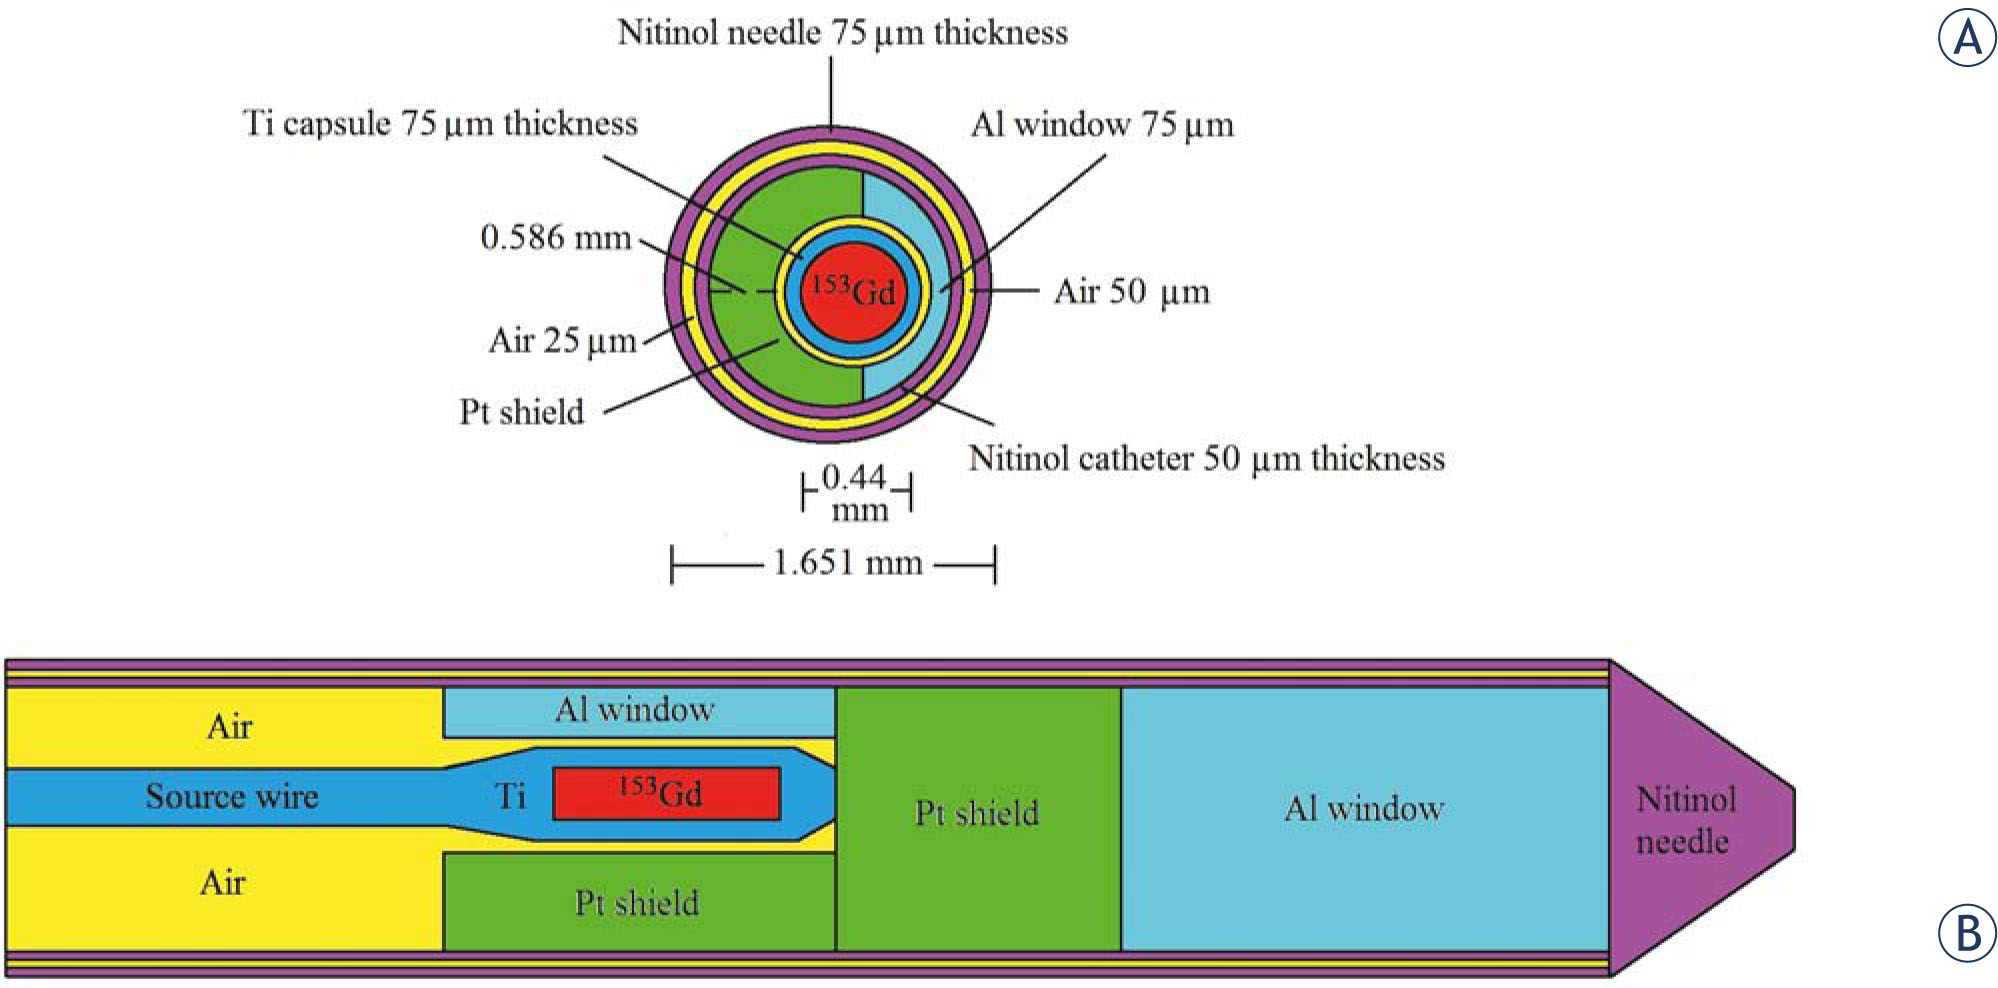
A schematic view of the simulated 153Gd source, Nitinol needle including Pt shields and Al windows. (A) transverse view, (B) longitudinal view. This figure is not in to a real scale. Polar angles that were used to calculate the anisotropy function.
Table 1
The energy spectrum of 153Gd radionuclide.18 In these data, the energy values were rounded to two decimal places
| Energy (keV) | Prevalence (%) |
|---|---|
| 5.18 | 0.374 |
| 5.82 | 0.976 |
| 5.82 | 0.1341 |
| 5.85 | 8.86 |
| 6.44 | 0.559 |
| 6.46 | 5.64 |
| 6.57 | 0.9214 |
| 6.62 | 0.0845 |
| 6.84 | 1.8512 |
| 7.48 | 0.947 |
| 7.77 | 0.173 |
| 7.79 | 0.244 |
| 14.06 | 0.0183 |
| 21.20 | 0.0224 |
| 40.47 | 0.00953 |
| 40.90 | 35.29 |
| 41.54 | 63.516 |
| 46.90 | 6.2516 |
| 47.04 | 12.13 |
| 47.37 | 0.1848 |
| 48.25 | 4.001 |
| 48.39 | 1.597 |
| 54.19 | 40.01622 |
| 69.67 | 2.41923 |
| 75.42 | 0.078323 |
| 83.37 | 0.1964 |
| 89.49 | 0.0694 |
| 96.88 | 0.0022 |
| 97.43 | 29 |
| 103.18 | 21.1123 |
| 118.11 | 0.000121 |
| 166.56 | 0.00033 |
| 172.30 | 0.00022 |
| 172.85 | 0.036017 |
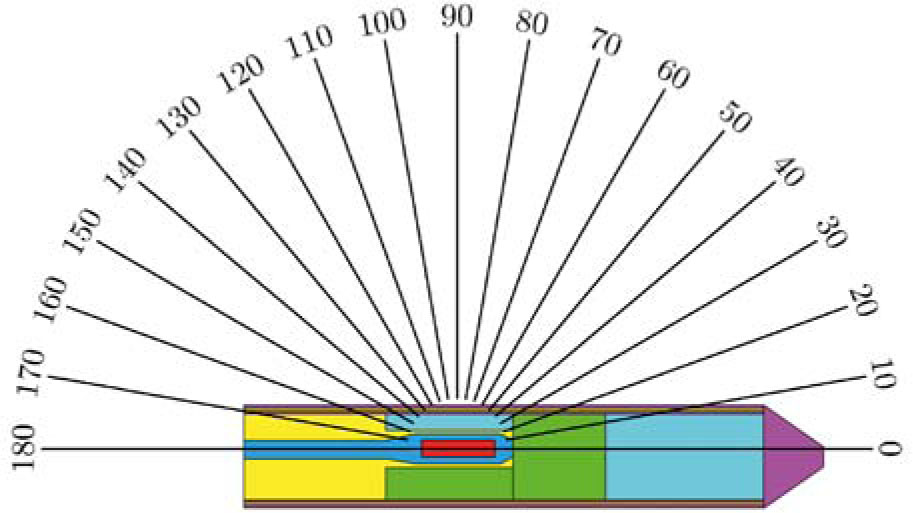
Polar distribution of angles in calculation of anisotropy function in the shielded mode.
Table 2
Radial dose function values for the non-shield and shield modes. The shield mode is related to the Pt and Al window sides
| g(r) | |||
|---|---|---|---|
| r(cm) | Without shield | With shield | |
| Pt shield side | Al window side | ||
| 0.5 | 0.90 | 0.52 | 0.93 |
| 1 | 1.00 | 1.00 | 1.00 |
| 1.5 | 1.06 | 1.39 | 1.04 |
| 2 | 1.11 | 1.73 1.04 | |
| 2.5 | 1.13 | 2.03 | 1.07 |
| 3 | 1.18 | 2.22 | 1.07 |
| 3.5 | 1.14 | 2.44 | 1.07 |
| 4 | 1.19 | 2.72 | 1.05 |
| 5 | 1.17 | 2.65 | 1.02 |
| 8 | 1.01 | 3.01 | 0.91 |
| 10 | 0.89 | 2.63 | 0.80 |
| 12 | 0.77 | 2.44 | 0.71 |
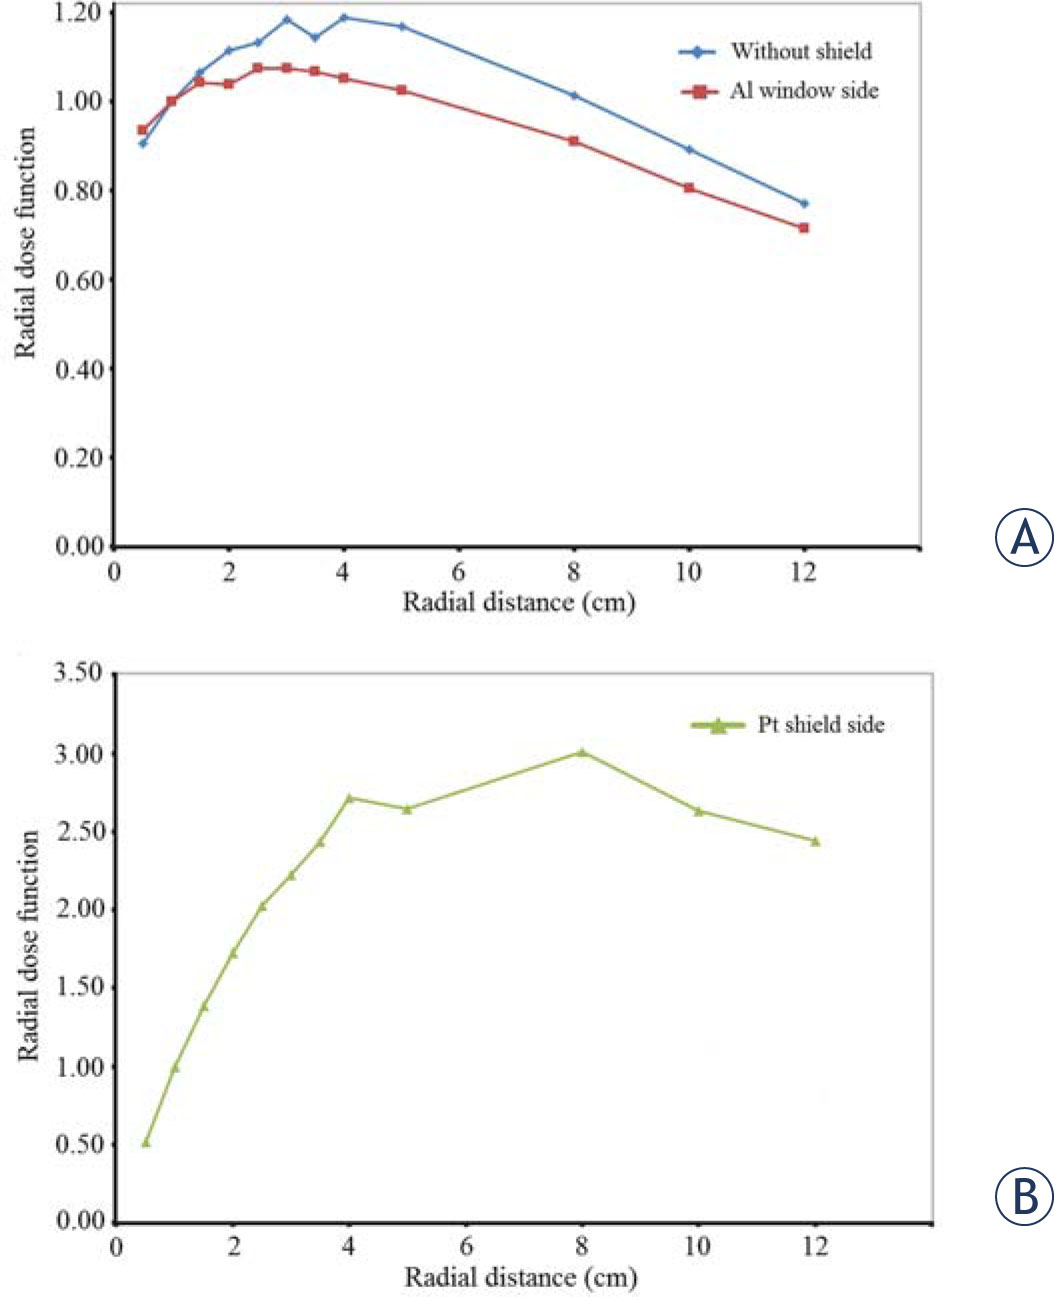
(A) Radial dose function for the 153Gd source without the shield and with the shield on Al window side (B) radial dose function for the shielded source at Pt shield side.
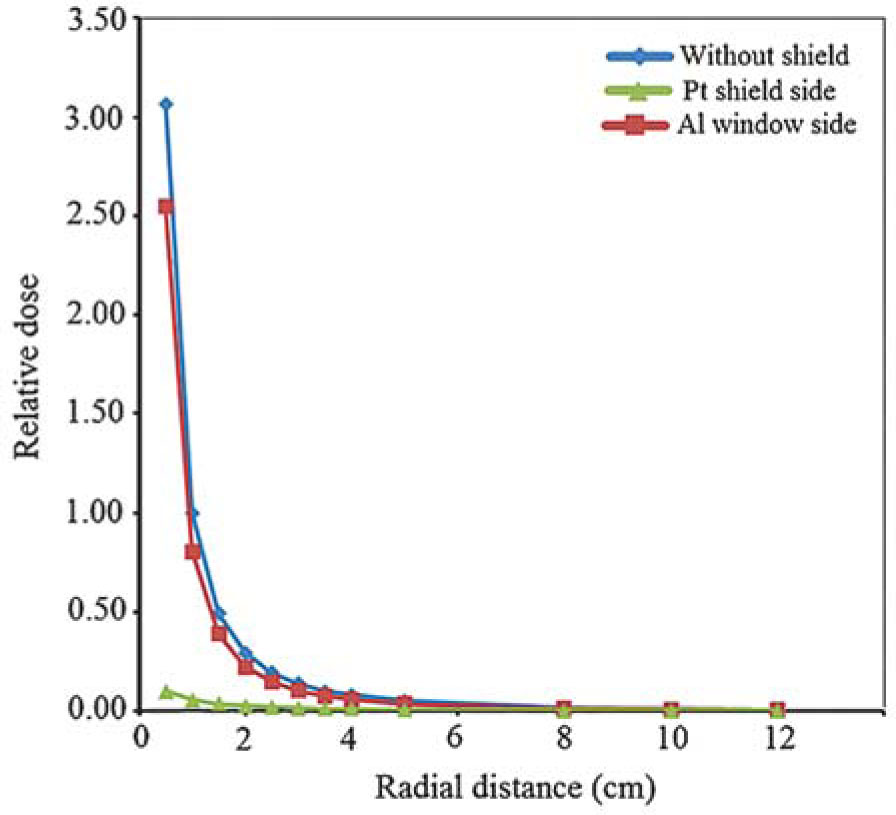
Relative dose in non-shielded mode, Pt shield side and aluminum window side in the shielded mode of the source. The normalization point is at 1 cm for the non-shielded case.
Table 3
Anisotropy function values for the 153Gd source at different distances for the non-shielded mode
| θ(degrees) | r(cm) | |||||
|---|---|---|---|---|---|---|
| 0.5 | 1 | 2 | 3 | 5 | 10 | |
| 0 | 0.71 | 0.59 | 0.48 | 0.41 | 0.29 | - |
| 10 | 0.75 | 0.63 | 0.58 | 0.51 | 0.44 | 0.75 |
| 20 | 0.82 | 0.76 | 0.69 | 0.64 | 0.63 | 0.81 |
| 30 | 0.86 | 0.83 | 0.77 | 0.75 | 0.76 | 0.86 |
| 40 | 0.90 | 0.85 | 0.85 | 0.84 | 0.87 | 0.91 |
| 50 | 0.95 | 0.91 | 0.90 | 0.90 | 0.93 | 0.94 |
| 60 | 0.95 | 0.98 | 0.94 | 0.94 | 0.96 | 0.96 |
| 70 | 1.00 | 0.96 | 0.97 | 0.98 | 0.98 | 0.97 |
| 80 | 0.99 | 0.99 | 0.97 | 0.98 | 1.01 | 1.00 |
| 90 | 1.00 | 1.00 | 1.00 | 1.00 | 1.00 | 1.00 |
| 100 | 0.97 | 0.97 | 0.99 | 1.00 | 1.01 | 1.00 |
| 110 | 1.01 | 0.95 | 0.97 | 0.97 | 0.96 | 0.97 |
| 120 | 0.97 | 0.95 | 0.92 | 0.94 | 0.96 | 0.97 |
| 130 | 0.95 | 0.93 | 0.89 | 0.90 | 0.93 | 0.94 |
| 140 | 0.92 | 0.87 | 0.85 | 0.84 | 0.87 | 0.90 |
| 150 | 0.88 | 0.80 | 0.78 | 0.76 | 0.79 | 0.87 |
| 160 | 0.83 | 0.74 | 0.68 | 0.65 | 0.63 | 0.81 |
| 170 | 0.76 | 0.65 | 0.56 | 0.50 | 0.45 | 0.75 |
| 180 | 0.69 | - | - | - | - | - |
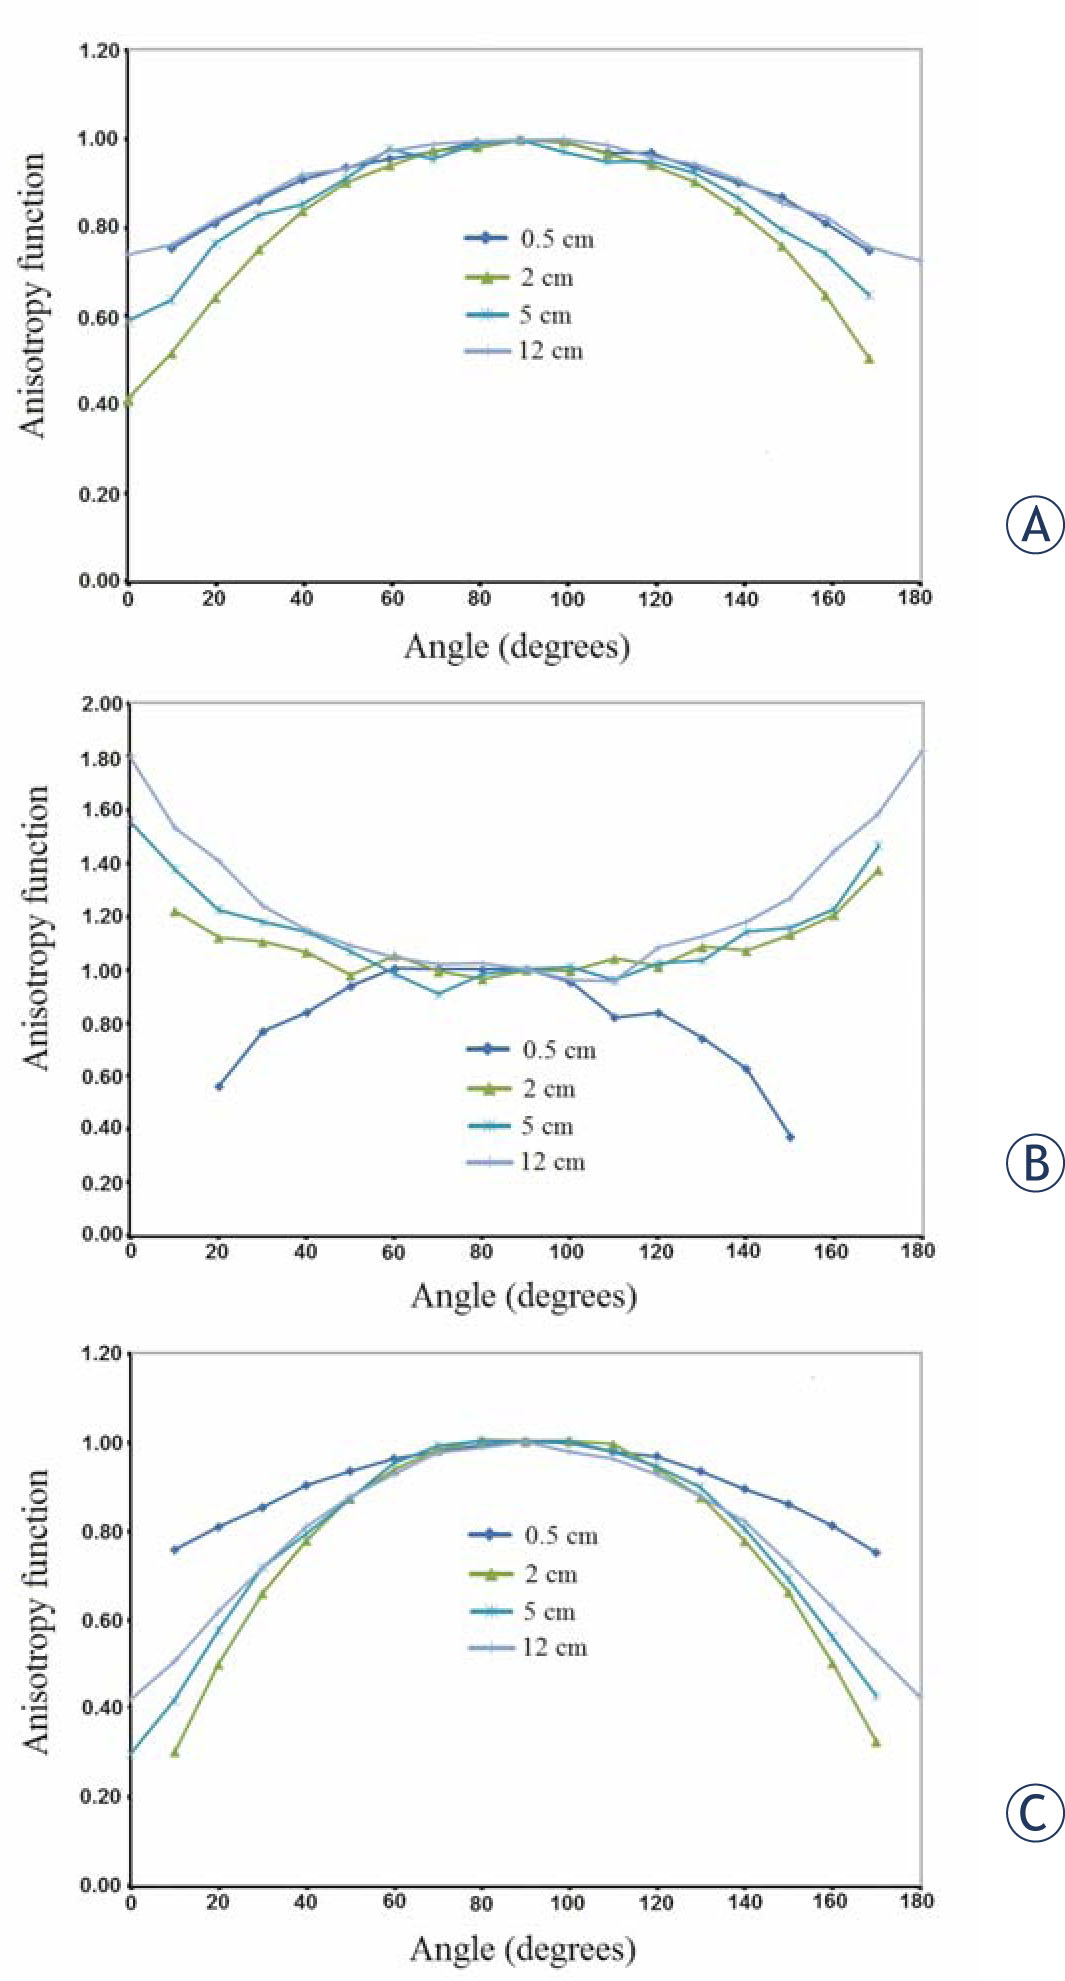
Anisotropy function for the 153Gd source: (A) non-shielded mode, (B) shielded mode, Pt shield side, (C) shielded mode, Al window side.
Table 4
Anisotropy function values for the 153Gd source at different distances for the shielded mode at the Pt and Al windows sides
| r(cm) | ||||||||||||||
|---|---|---|---|---|---|---|---|---|---|---|---|---|---|---|
| θ(degree) | Pt shield side | Al window side | ||||||||||||
| 0.5 | 1 | 2 | 3 | 5 | 10 | 12 | 0.5 | 1 | 2 | 3 | 5 | 10 | 12 | |
| 0 | 0.42 | 0.39 | 0.30 | - | - | - | - | 1.80 | 1.78 | 1.56 | - | - | - | - |
| 10 | 0.51 | 0.52 | 0.42 | 0.35 | 0.31 | 0.29 | 0.76 | 1.54 | 1.57 | 1.38 | 1.32 | 1.22 | 0.35 | - |
| 20 | 0.62 | 0.61 | 0.58 | 0.51 | 0.50 | 0.55 | 0.81 | 1.41 | 1.36 | 1.23 | 1.21 | 1.12 | 0.88 | 0.38 |
| 30 | 0.72 | 0.71 | 0.72 | 0.66 | 0.66 | 0.70 | 0.85 | 1.24 | 1.31 | 1.18 | 1.17 | 1.10 | 0.87 | 0.56 |
| 40 | 0.81 | 0.81 | 0.79 | 0.77 | 0.78 | 0.81 | 0.90 | 1.15 | 1.23 | 1.14 | 1.07 | 1.07 | 1.05 | 0.77 |
| 50 | 0.88 | 0.88 | 0.87 | 0.86 | 0.87 | 0.90 | 0.93 | 1.09 | 1.14 | 1.07 | 1.08 | 0.98 | 0.86 | 0.84 |
| 60 | 0.93 | 0.91 | 0.95 | 0.92 | 0.94 | 0.97 | 0.96 | 1.05 | 1.07 | 0.98 | 1.06 | 1.05 | 0.91 | 0.94 |
| 70 | 0.98 | 0.96 | 0.99 | 0.97 | 0.98 | 1.01 | 0.98 | 1.02 | 1.07 | 0.91 | 1.04 | 0.99 | 1.03 | 1.00 |
| 80 | 0.99 | 0.99 | 1.00 | 1.00 | 1.00 | 1.06 | 0.99 | 1.02 | 1.01 | 0.98 | 0.99 | 0.96 | 1.00 | 1.00 |
| 90 | 1.00 | 1.00 | 1.00 | 1.00 | 1.00 | 1.00 | 1.00 | 1.00 | 1.00 | 1.00 | 1.00 | 1.00 | 1.00 | 1.00 |
| 100 | 0.98 | 0.99 | 1.00 | 0.98 | 1.00 | 1.02 | 1.00 | 0.96 | 1.01 | 1.01 | 1.04 | 0.99 | 1.03 | 1.00 |
| 110 | 0.96 | 0.97 | 0.98 | 0.97 | 0.99 | 0.97 | 0.98 | 0.96 | 1.07 | 0.96 | 1.01 | 1.04 | 0.99 | 0.95 |
| 120 | 0.93 | 0.93 | 0.95 | 0.92 | 0.94 | 0.96 | 0.97 | 1.08 | 1.09 | 1.02 | 1.07 | 1.01 | 1.08 | 0.82 |
| 130 | 0.88 | 0.89 | 0.90 | 0.88 | 0.88 | 0.93 | 0.93 | 1.13 | 1.24 | 1.03 | 1.07 | 1.09 | 0.95 | 0.84 |
| 140 | 0.82 | 0.83 | 0.81 | 0.77 | 0.78 | 0.84 | 0.89 | 1.18 | 1.21 | 1.14 | 1.12 | 1.07 | 1.04 | 0.74 |
| 150 | 0.73 | 0.70 | 0.69 | 0.67 | 0.66 | 0.71 | 0.86 | 1.27 | 1.29 | 1.16 | 1.15 | 1.13 | 0.87 | 0.63 |
| 160 | 0.63 | 0.62 | 0.56 | 0.52 | 0.50 | 0.54 | 0.81 | 1.45 | 1.53 | 1.23 | 1.33 | 1.21 | 0.89 | 0.37 |
| 170 | 0.53 | 0.49 | 0.43 | 0.36 | 0.33 | 0.30 | 0.75 | 1.59 | 1.57 | 1.47 | 1.51 | 1.38 | 1.06 | - |
| 180 | 0.43 | 0.41 | - | - | - | - | - | 1.83 | 1.89 | - | - | - | - | - |
Table 5
Mass attenuation coefficient (rμ/ρ) of Pt, Al and Ti in the 40 keV-100 keV energy range21
| Energy (keV) | Pt | Al | Ti |
|---|---|---|---|
| 40 | 12.45 | 0.57 | 2.21 |
| 50 | 6.95 | 0.37 | 1.21 |
| 60 | 4.34 | 0.28 | 0.77 |
| 80 | 8.73 | 0.20 | 0.41 |
| 100 | 4.99 | 0.17 | 0.27 |
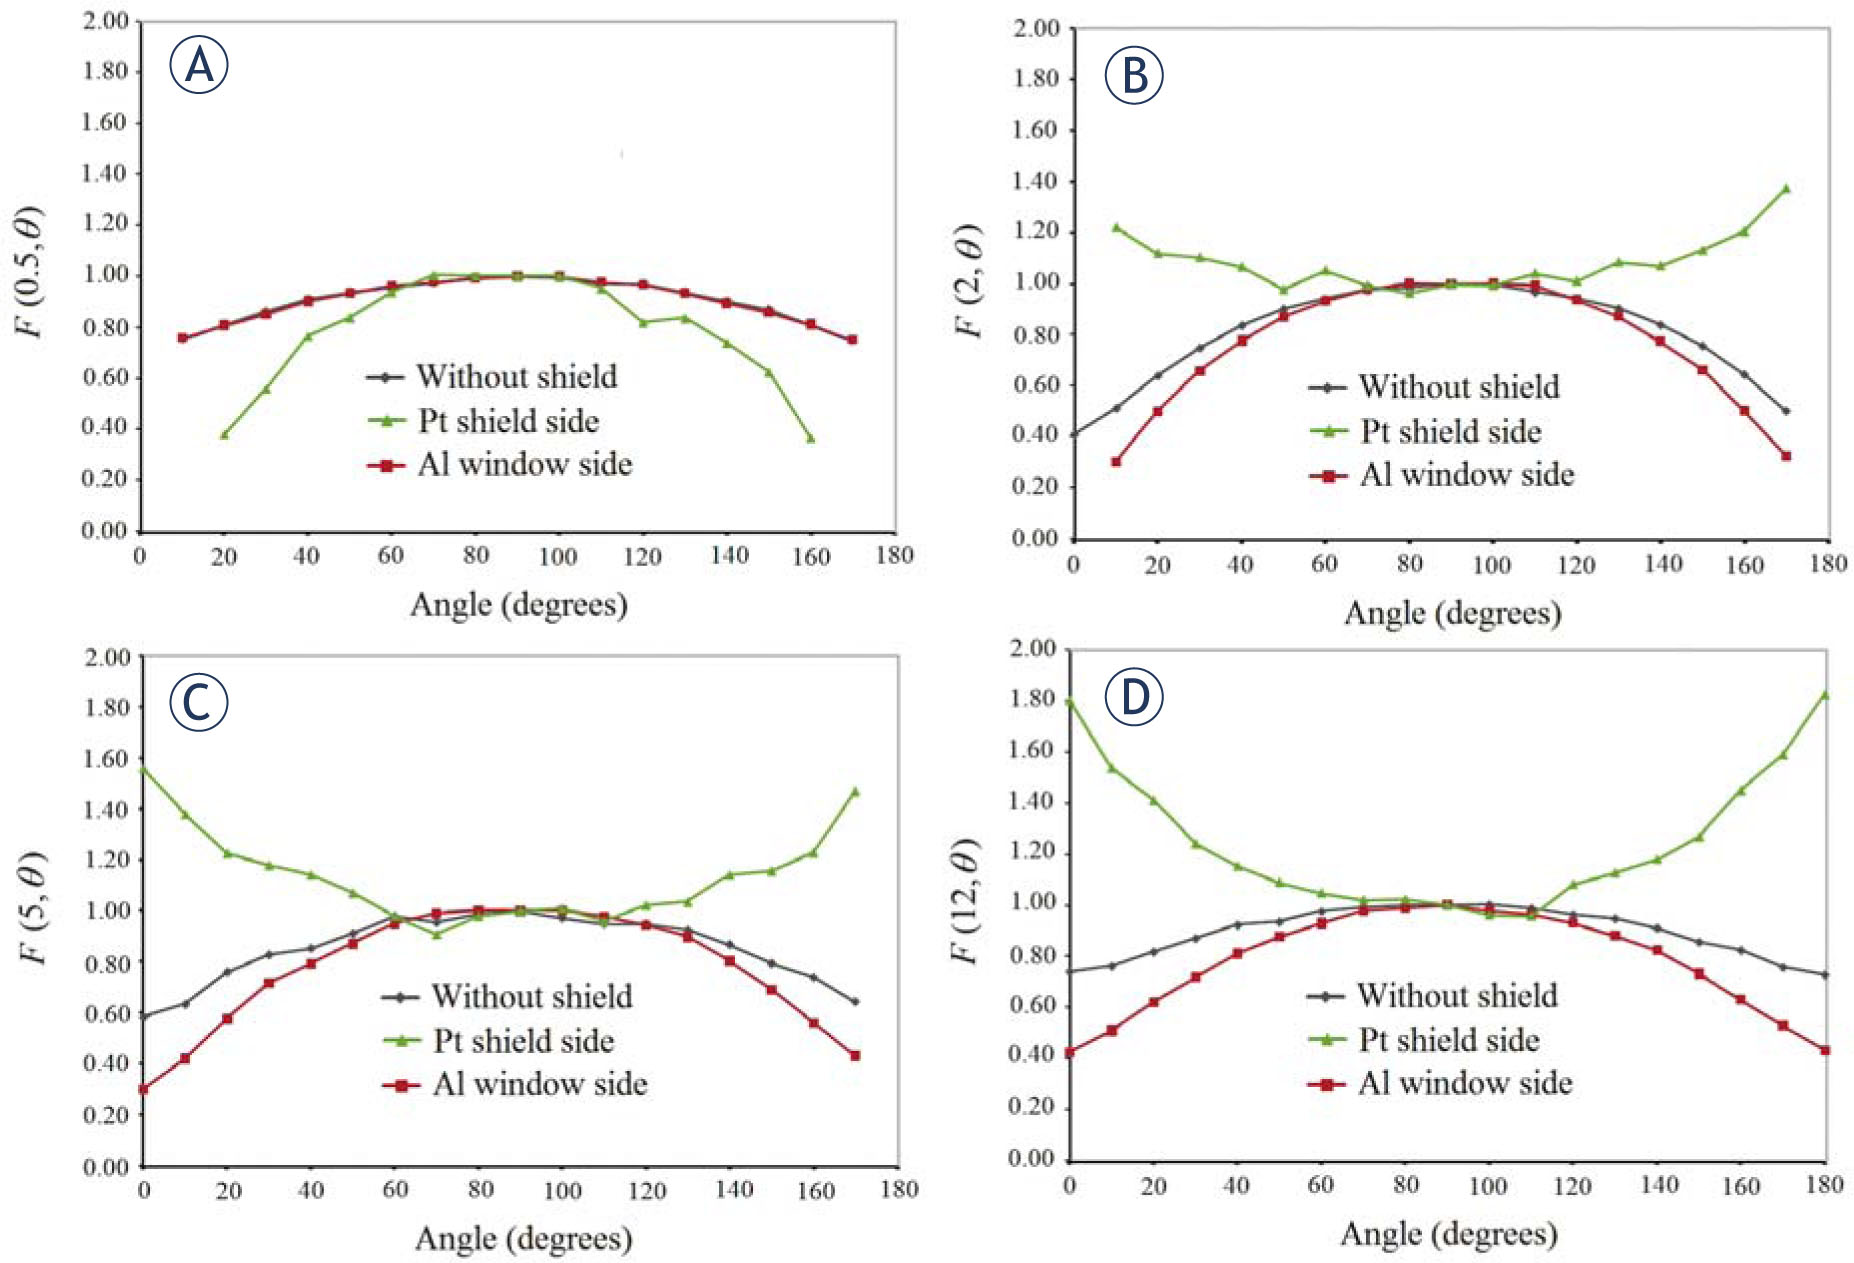
Comparison of anisotropy function for non-shielded mode, Pt shielded mode, Al window mode. All modes are presented for distances: (A) 0.5 cm, (B) 2 cm, (C) 5 cm, (D) 12 cm.
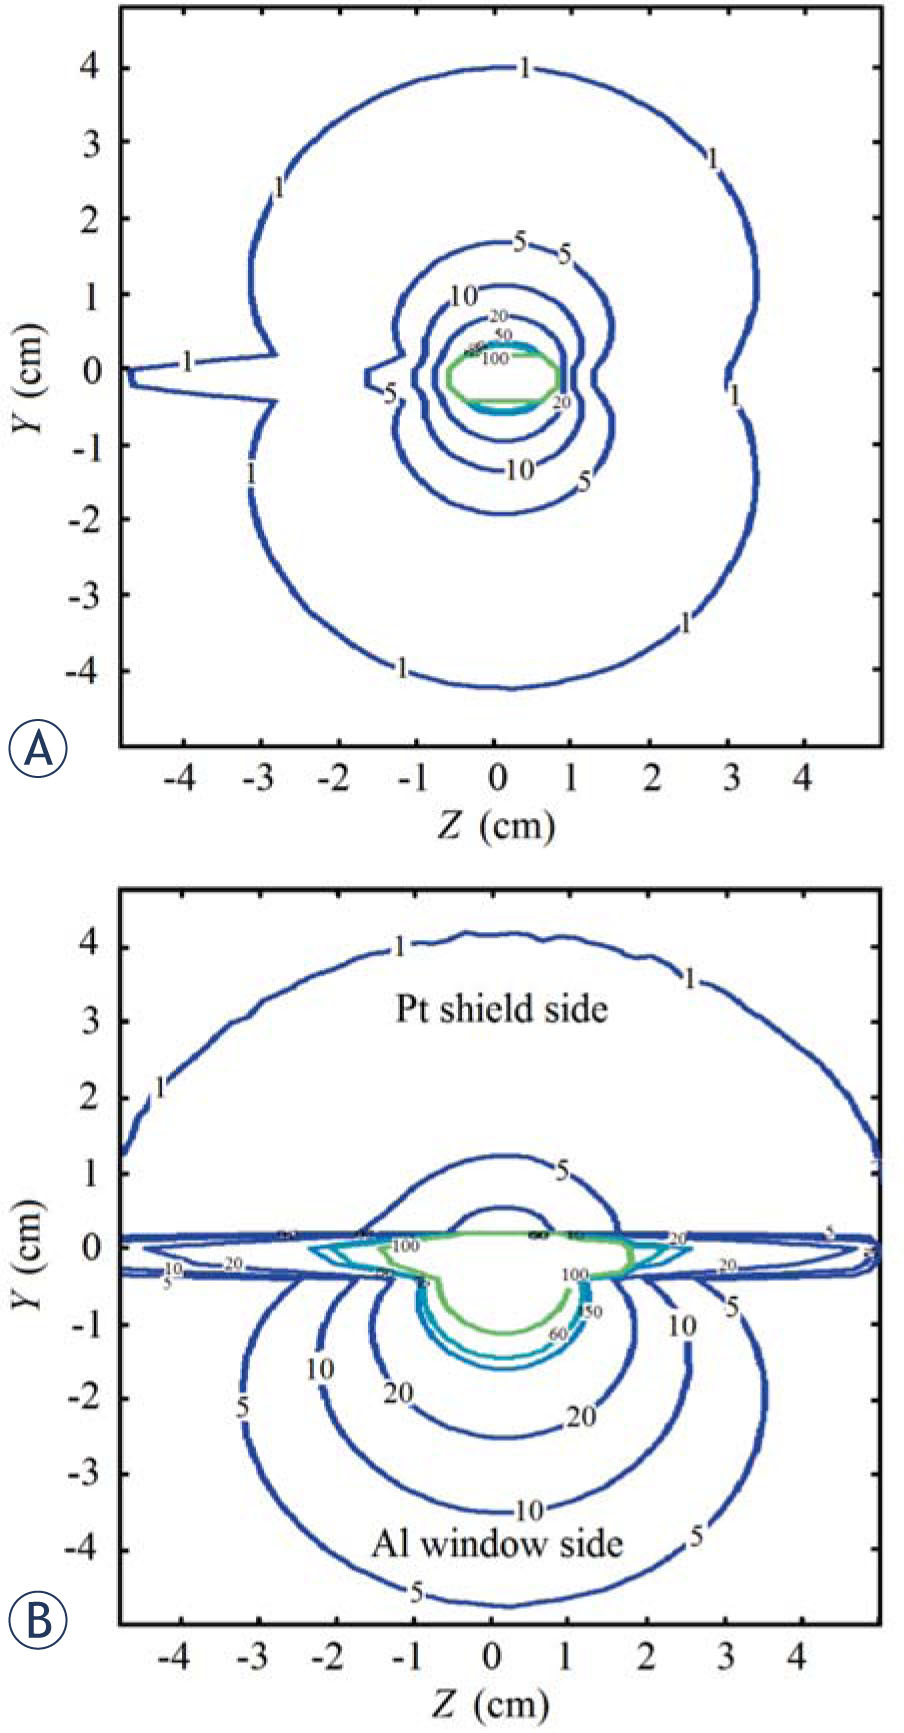
Isodose curves (%): (A) non shielded source, (B) shielded source. The dose distributions were normalized to the dose at 1 cm distance from the source at transverse plane. The Z axis is on the longitudinal axis of the source.