
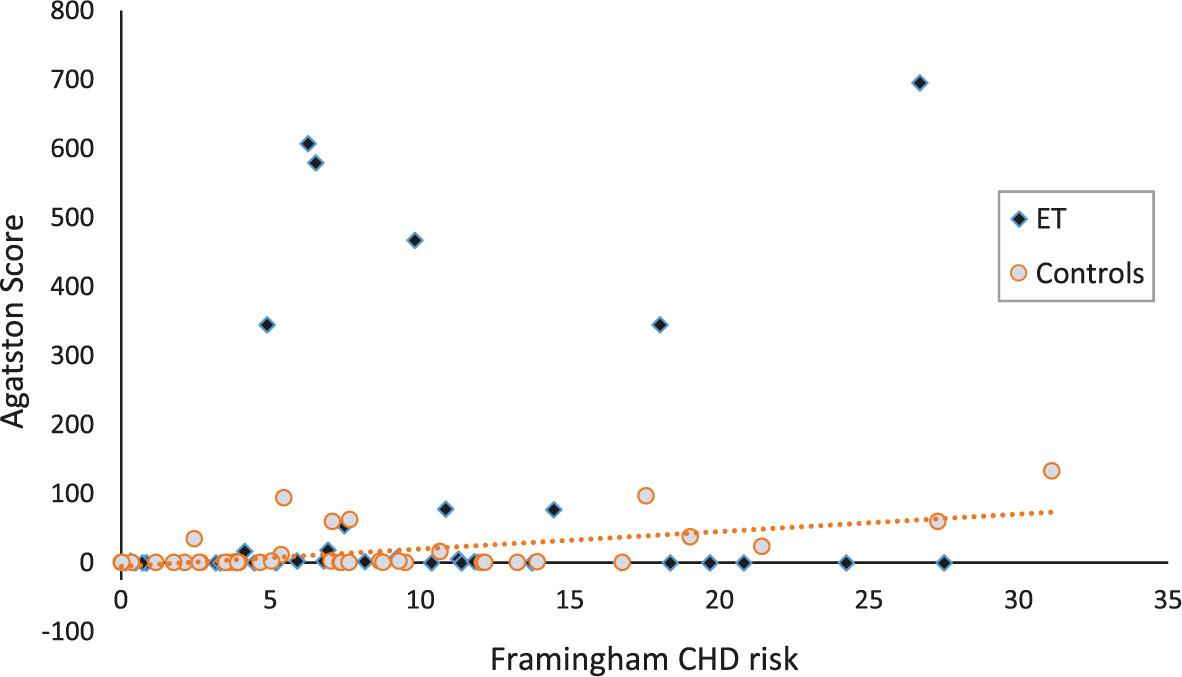
Coronary calcium burden_ Median and interquartile range are given for the Agatston score of coronary calcification, and the number of subjects with an Agatston score of > 160 is given_ The comparison between groups were tested by χ-square1- or Mann-Whitney test2
| Coronary calcuim burden | ET patients (n= 40) | Control group (n= 42) | Comparison between groups (p) |
|---|---|---|---|
| 2Agatston score | 0.1 (0-16.85) | 0 (0-8.55) | 0.26 |
| 1Agatston score > 160 (yes/no) | 6/34 | 0/42 | <0.01 |
Endothelial function of the digital arteries - reactive hyperemia index (RHI) and estimate of vascular stiffness - augmentation index (AI)_ Means and standard deviations are given for the normally distributed RHI, medians and interquartile range are given for non-normally distributed AI_ Comparisons between groups were tested by the Student’s t-test1, or the Mann-Whitney test2
| ET patients (n= 40) | Control group (n= 42) | Comparison between groups (p) | |
|---|---|---|---|
| 1RHI | 2.10 (0.57) | 2.35 (0.62) | 0.07 |
| 2AI [%] | 19 (3-30) | 13 (5-22) | 0.38 |
Blood cell count and C-reactive protein (CRP)_ Mixed cells denote a composite reading for monocytes, eosinophils and basophils_ When CRP was reported as < 5 mg/L, a value of 2_5 mg/L was ascribed to the subject, therefore the CRP values are only an approximation_ Mean and standard deviation are shown for normally distributed data; median and interquartile range are given for non-normally distributed data_ The comparisons between groups were tested by Student’s t-test1, or by Mann-Whitney test2
| Variable | ET patients (n= 40) | Control group (n= 42) | Comparison between groups (p) |
|---|---|---|---|
| 1Red blood cells [10^12/L] | 4.37 (0.67) | 4.76 (0.41) | <0.01 |
| 1 Platelets [10^9/L] | 509 (182) | 243 (53) | <0.001 |
| 1Leukocytes [10^9/L] | 7.60 (3.00) | 7.02 (1.63) | 0.28 |
| 1Lymphocytes [10^9/L] | 1.67 (0.80) | 2.23 (0.75) | <0.01 |
| 1 Neutrophils [10^9/L] | 5.15 (2.48) | 4.15 (1.20) | 0.02 |
| 2Mixed cells [10^9/L] | 0.6 (0.4-0.9) | 0.6 (0.5-0.7) | 0.76 |
| 2CRP [mg/L] | 5.0 (2.5-8.4) | 5.4 (2.5-6.1) | 0.27 |
Asymptomatic carotid plaques, carotid β-stiffness index and estimated pulse wave velocity_ Mean and standard deviation are given for normally distributed continuous data, median and interquartile range are given for non-normally distributed continuous data and the number of subjects with a carotid plaque score of ≥2 is given_ Comparisons between groups were tested by: χ-square1, Student’s t-test2, or the Mann-Whitney test3
| ET patients (n= 40) | Control group (n= 42) | Comparison between groups (p) | |
|---|---|---|---|
| 3 Carotid plaque score | 1 (0-1.25) | 0 (0-2) | 0.30 |
| 1 Carotid plaque score ≥2 (yes/no) | 10/30 | 14/28 | 0.41 |
| 2β-stiffness index | 7.75 (2.34) | 8.44 (2.81) | 0.23 |
| 2pulse wave velocity (m/s) | 6.21 (1.00) | 6.45 (1.04) | 0.46 |
Cardiovascular 10-year risk estimation by the Framingham risk equations_ Median and interquartile range are shown_ Comparisons between groups were tested by the Mann-Whitney test
| Framingham 10-year risk calculation (%) | ET patients(n= 40) | Control group (n= 42) | Comparison between groups (p) |
|---|---|---|---|
| CHD | 7.80 (3.98-13.73) | 7.20 (3.57-11.37) | 0.52 |
| MI | 2.87 (1.25-6.72) | 2.17 (0.77-4.73) | 0.47 |
| Stroke | 2.93 (1.19-5.37) | 2.59 (1.49-4.09) | 0.73 |
| CVD | 14.56 (7.16 – 23.68) | 12.99 (6.43-19.52) | 0.84 |
Baseline characteristics_ Numbers of subjects are given for discrete data_ Mean and standard deviation are shown for normally distributed continuous data; median and interquartile range are given for non-normally distributed continuous data_ Comparisons between groups were tested by χ-square1, Student’s t-test2, or Mann-Whitney test3
| Variable | ET patients (n= 40) | Control group (n= 42) | Comparison between groups (p) |
|---|---|---|---|
| 2 Age (years) | 57.1 (14.1) | 58.2 (13.1) | 0.71 |
| 1 Sex (M/F) | 14/26 | 16/26 | 0.77 |
| 2 BMI (kg/m2) | 25.4 (3.5) | 27.0 (4.5) | 0.07 |
| 2 Waist circumference (cm) | |||
| M | 95.4 (10.4) | 101.1(10.2) | 0.14 |
| F | 89.7 (8.8) | 89.4 (13.6) | 0.92 |
| 3 Systolic blood pressure (mmHg) | 139 (129-148) | 136 (130-143) | 0.33 |
| 3 Diastolic blood pressure (mmHg) | 80 (73-89) | 80 (74-87) | 0.92 |
| 2Total cholesterol (mmol/l) | 5.01 (1.07) | 5.23 (0.83) | 0.30 |
| 2LDL-cholesterol (mmol/l) | 2.73 (0.77) | 2.86 (0.69) | 0.42 |
| 2HDL-cholesterol (mmol/l) | 1.44 (0.48) | 1.63 (0.48) | 0.07 |
| 2Triglycerides (mmol/l) | 1.82 (0.79) | 1.65 (0.82) | 0.33 |
| 1 Current smoking (yes/no) | 5/35 | 3/39 | 0.41 |
| 1 Ever smoking (yes/no) | 16/24 | 11/31 | 0.12 |
| 1Diabetes (yes/no) | 3/37 | 0/42 | 0.07 |
| 3Serum glucose (mmol/l) | 5.4 (4.7-6.1) | 5.1 (4.8-5.6) | 0.64 |
| Kidney disease (yes/no) | 0/40 | 0/42 | - |
| 2Serum creatinine (μmol/l) | 75.7 (15.0) | 75.7 (14.1) | 0.99 |
| Family history of premature CVD (yes/no) | 0/40 | 0/42 | - |
| 1Family history of CVD (yes/no) | 16/24 | 16/26 | 0.86 |