
Figure 1
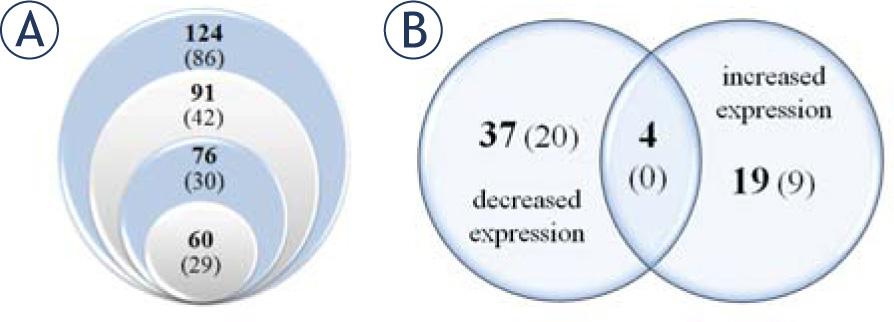
Figure 2
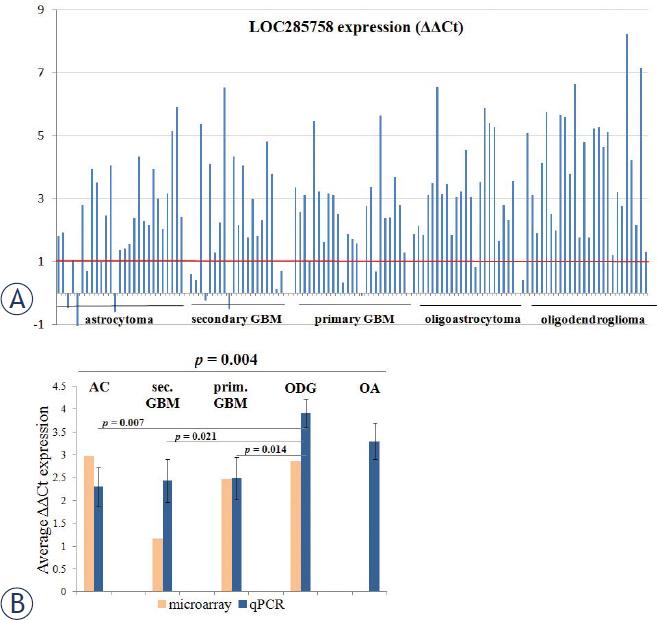
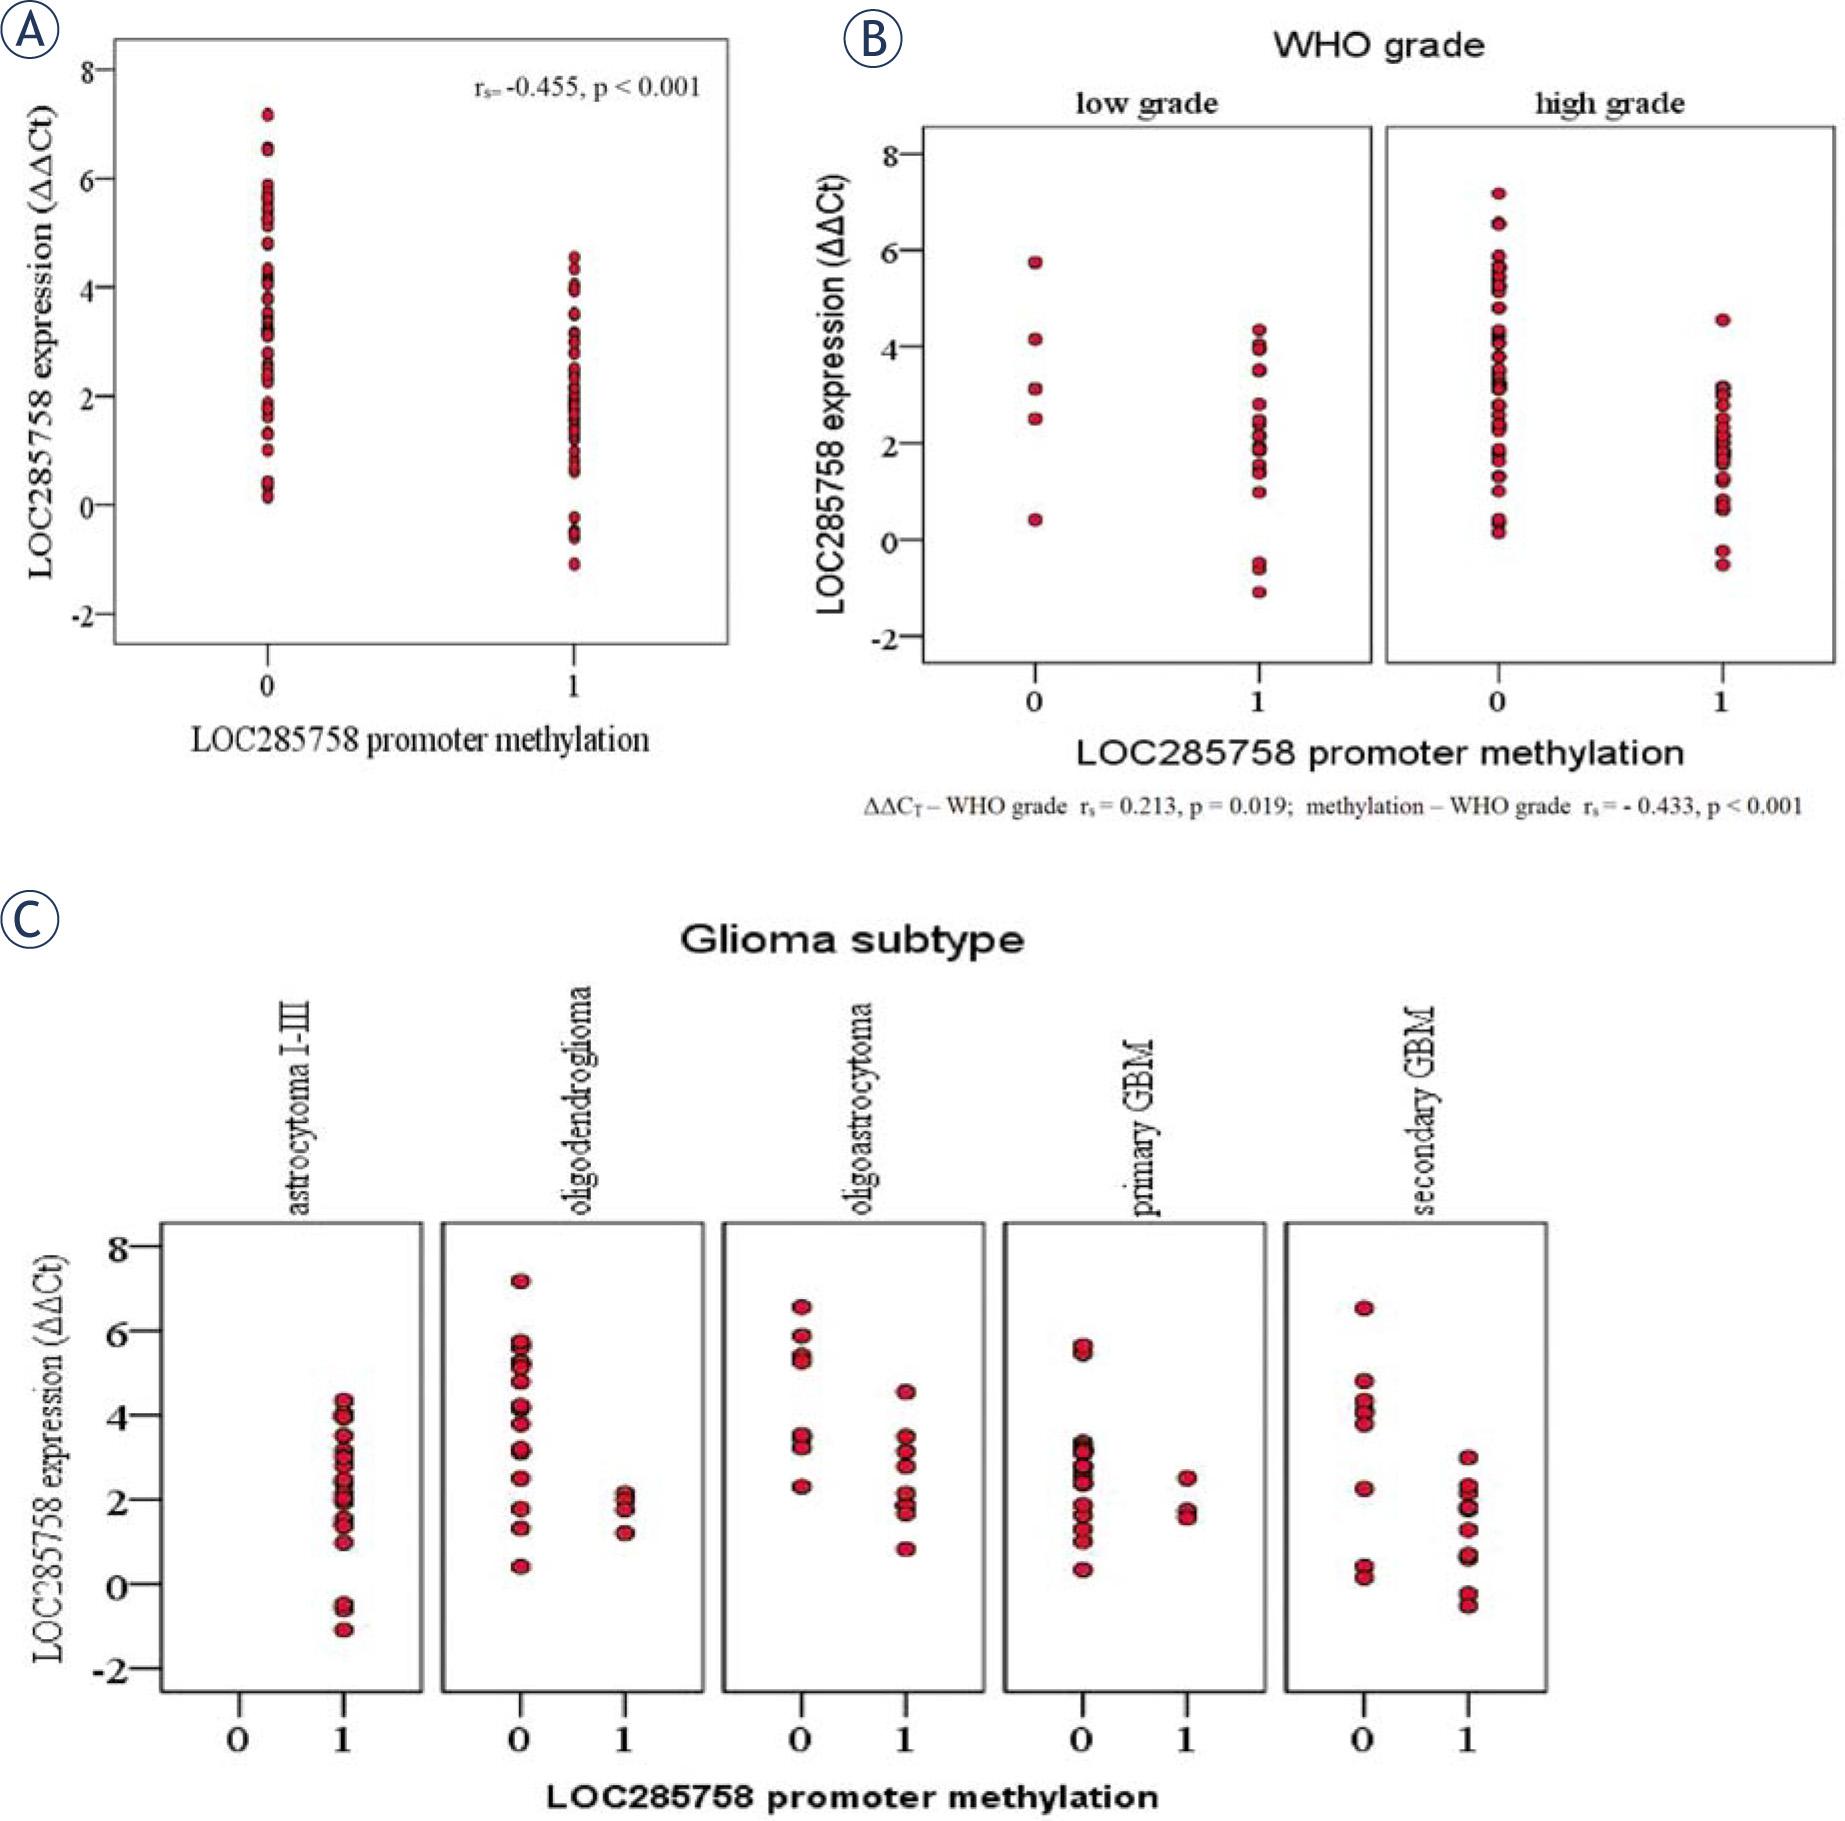
Figure 3
Association of LOC285758 expression with patients demographic data and glioma hallmark biomarkers: mutations of IDH1 and TP53, copy number variations of CDKN2A and CDKN2B, and loss of chromosome arm 1p and 19q (1p/19q co-deletion)
| LOC285758 expression | LOC285758 promoter methylation | |||
|---|---|---|---|---|
| rs | p-value | rs | p-value | |
| Gender | -0.044 | 0.634 | 0.009 | 0.920 |
| Age at diagnosis (< 45y >) | 0.065 | 0.475 | -0.313 | < 0.001 |
| WHO grade (low/high) | 0.213 | 0.019 | -0.433 | < 0.001 |
| IDH1 (wt/mut) | 0.375 | < 0.001 | 0.096 | 0.331 |
| TP53(wt/mut) | -0.083 | 0.483 | 0.153 | 0.178 |
| 1p loss (wt/del) | 0.310 | 0.005 | -0.396 | < 0.001 |
| 19q loss (wt/del) | 0.267 | 0.032 | -0.360 | 0.002 |
| 1p/19q loss (wt/del) | 0.262 | 0.014 | -0.373 | < 0.001 |
| CDKN2A (wt/del) | 0.085 | 0.477 | -0.231 | 0.042 |
| CDKN2B (wt/del) | 0.093 | 0.435 | -0.240 | 0.033 |
Patients’ demographics and glioma histopathological classification
| Patients demographic | ||
|---|---|---|
| Number of patients | 157 | |
| Gender (female/male) | 67/90 (1 : 1.34) | |
| Mean age at diagnosis (years) | 43.8 (SD ±18,89) | |
| # < 45 years | 86 | |
| # > 45 years | 71 | |
| Glioma classification | Glioma subtype | WHO grade |
| Astrocytoma (AC) | 15 pilocytic | WHO I |
| 9 diffuse | WHO II | |
| 11 diffuse with signs of anaplasia | WHO II-III | |
| 9 anaplastic | WHO III | |
| 23 secondary GBM | WHO IV | |
| 31 primary GBM | WHO IV | |
| Oligodendroglioma (ODG) | 4 diffuse | WHO II |
| 5 diffuse with signs of anaplasia | WHO II-III | |
| 28 anaplastic | WHO III | |
| Oligoastrocytoma (OAC) | 2 diffuse | WHO II |
| 3 diffuse with signs of anaplasia | WHO II-III | |
| 17 anaplastic | WHO III |
Primers used for validation of LOC285758 expression profiling results, reference genes and determining methylation status of lncRNA’s promoter
| Quantitative real-time PCR | |||
|---|---|---|---|
| Gene | Assay ID | Amplicon length (bp) | Annealing temperature (°C) |
| LOC285758 | Hs.PT.58.26012748 | 129 | 60 |
| GAPDH | QT00079247 | 95 | 55 |
| Gene | Primer sequence (5’ - 3’) | Amplicon length (bp) | Annealing temperature (°C) |
| U6 | CTCGCTTCGGCAGCACA AACGCTTCACGAATTTGCGT | 94 | 60 |
| Methylation sensitive HRM | |||
| Gene | Oligonucleotide sequence (5’ – 3’) | Amplicon length (bp) | Annealing temperature (°C) |
| LOC285758 F | TTGTTTTTTGAAAGTTTTTTGA | 118 | 55 |
| LOC285758 R | AAACACAAAAAACCTAACAAAAA | ||
Top 10 lncRNAs that showed significantly increased/decreased expression in four glioma subtypes, using the LncPath Human Epigenetic Pathway microarray (ArrayStar, USA)
| Astrocytoma II+III II+III – tumours of WHO grade II and III; (abs) = absolute value; FC = fold change | Secondary GBM | Primary GBM | Oligodendroglioma | ||||
|---|---|---|---|---|---|---|---|
| FC(abs) | Gene Name | FC(abs) | Gene Name | FC(abs) | Gene Name | FC(abs) | Gene Name |
| TOP 10 OVER-EXPRESSED | |||||||
| 9.775 | RP11-434O22.1 | 9.840 | APOC2 | 11.343 | AK024556 | 10.085 | RP6-201G10.2 |
| 7.863 | LOC285758 | 9.105 | AK024556 | 9.761 | FJ209302 | 7.233 | LOC285758 |
| 6.203 | LOC100129034 | 7.971 | LOC100129034 | 9.402 | AK055628 | 6.241 | GAS5 |
| 5.247 | RP11-264F23.3 | 7.578 | AK055628 | 9.267 | H19 | 5.454 | RP11-264F23.3 |
| 5.211 | RP6-201G10.2 | 4.509 | RP11-145M9.3 | 7.012 | RP11-434O22.1 | 5.360 | LOC100216546 |
| 5.107 | APOC2 | 4.243 | RP11-73E17.2 | 6.720 | APOC2 | 5.043 | SNRPE |
| 4.374 | RP11-770J1.3 | 3.657 | KB-1836B5.1 | 5.527 | LOC285758 | 4.991 | AK024556 |
| 4.211 | HOXA11-AS | 3.394 | H19 | 4.851 | LOC100216546 | 4.930 | AC009506.1 |
| 3.861 | RP3-405J24.1 | 2.878 | BANCR | 4.770 | LOC100129034 | 4.351 | RP11-73E17.2 |
| 3.795 | AK055628 | 2.695 | AB447886 | 4.525 | HOXA11-AS | 3.846 | LOC286059 |
| TOP 10 UNDER-EXPRESSED | |||||||
| 9.638 | RP11-678P16.1 | 24.555 | MEG3 | 22.494 | MEG3 | 43.328 | RP11-678P16.1 |
| 7.026 | XLOC_013368 | 11.341 | AK054921 | 16.532 | AK054921 | 23.879 | FABP5P3 |
| 6.797 | AK054921 | 8.050 | AF520792 | 11.157 | RP11-678P16.1 | 18.840 | DGCR5 |
| 6.148 | MEG3 | 6.845 | DGCR5 | 8.208 | DGCR5 | 8.073 | MEG3 |
| 6.003 | RP11-18F14.2 | 6.623 | XLOC_013368 | 8.207 | XLOC_013368 | 7.092 | AK054921 |
| 5.820 | HAR1A | 6.470 | AK054970 | 7.979 | HAR1B | 6.887 | XLOC_013368 |
| 5.052 | SNAR-A2 | 6.243 | HAR1A | 6.325 | HAR1A | 6.318 | NEAT1 |
| 4.216 | FABP5P3 | 6.114 | XIST | 6.218 | SNAR-A2 | 6.205 | SEPT7P6 |
| 4.082 | RP11-325F22.4 | 5.799 | MIAT | 6.066 | RP11-208G20.2 | 6.090 | CASC2 |
| 3.887 | SEPT7P6 | 5.712 | SNAR-A2 | 5.652 | XLOC_008014 | 5.873 | TMSB10P2 |