
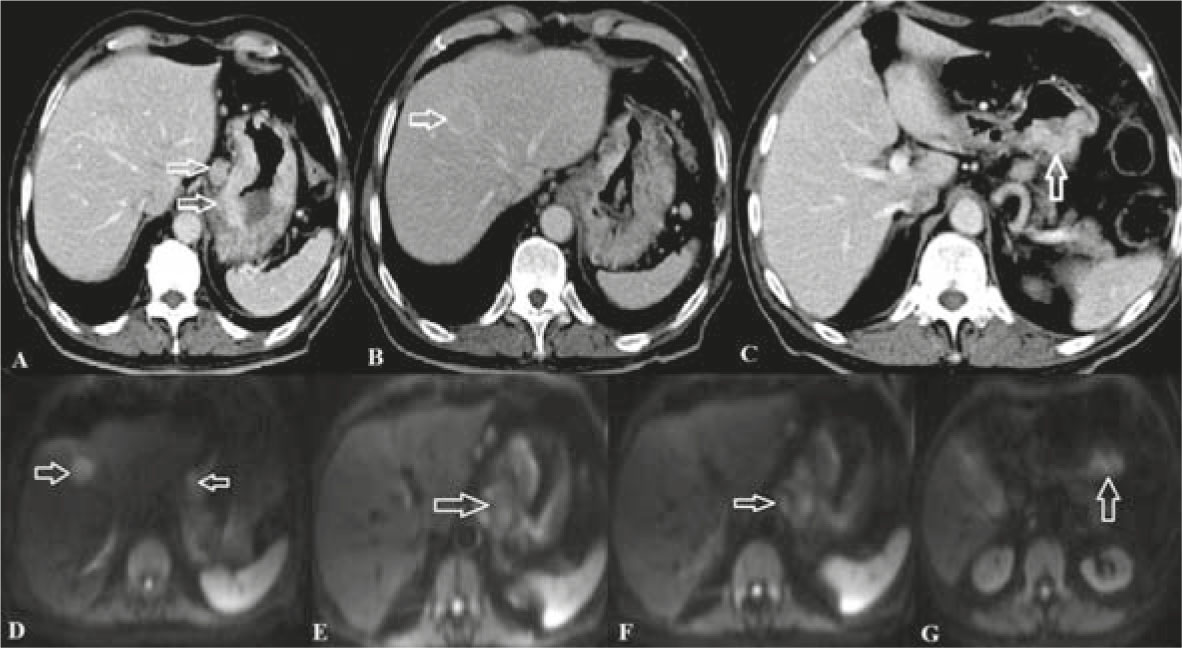
T4N3M1 C Axial MDCT (A,B,C) and DWI (D,E,D,F,G). (A) Axial contrasted-enhanced MDCT shows gastric corpus tumor and adjacent lymphadenopathies, (B) peripherally contrast enhanced lesions in the liver (metastasis), and (C) an invasive mass extending from the posterior of the gastric corpus to the fatty tissue (arrows). On DWI (D–G): on b800 DWI (D, E) there are diffusion restrictions in the gastric corpus and liver (Gastric tumor + liver metastasis), (F) restrictions that are compatible with lymphadenopathies are seen in the gastro-hepatic ligament, hepatic hilum, and the celiac axis, and (G) invasion of the fatty tissue in the posterior of the gastric corpus (arrow).
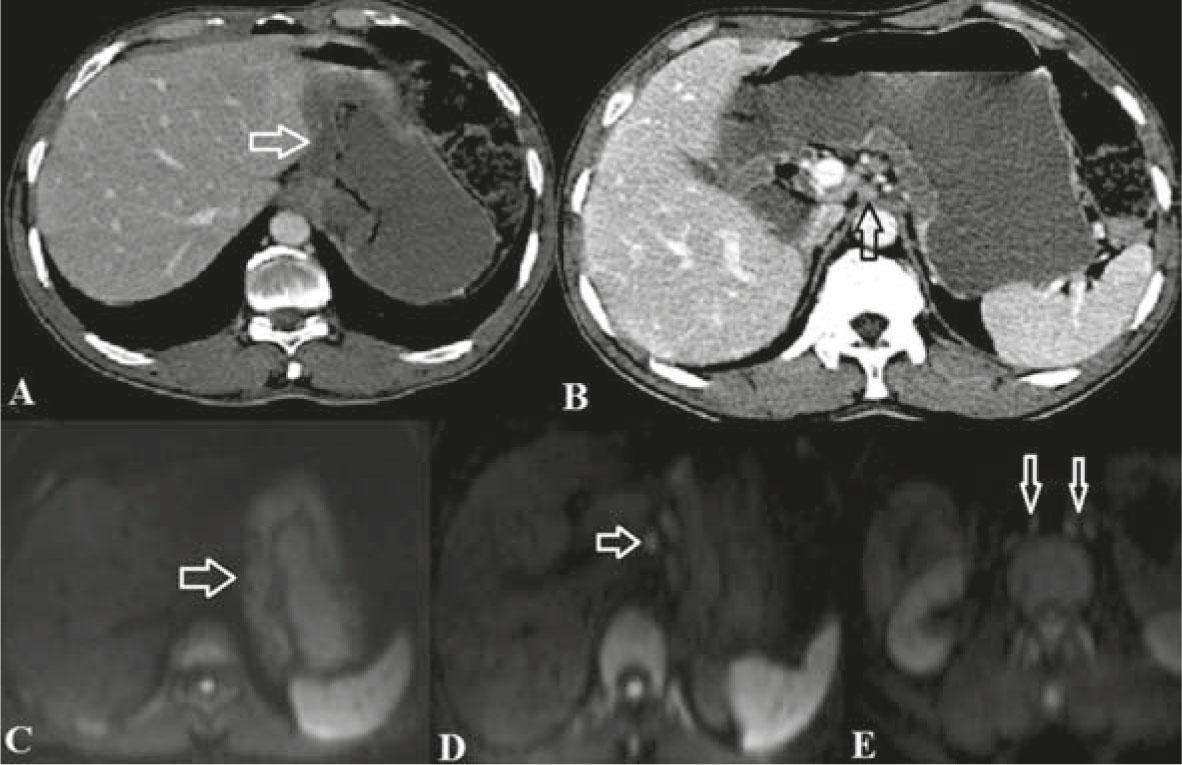
T2N3M0 C Axial MDCT (A, B) and DWI (C,D,E) . (A,B) axialcontrast-enhanced MDCT: Wall thickness in the gastric cardia-corpus and gastro-hepatic ligament and para-aorticlymphadenopathies, (C, D, E) b800 DWI images: (C) Diffusion restriction in the gastric cardia and corpus, (D) mm sized lymphadenopathiesin the gastrohepatic ligament, and(e)para-aorticandceliac lymphadenopathies.
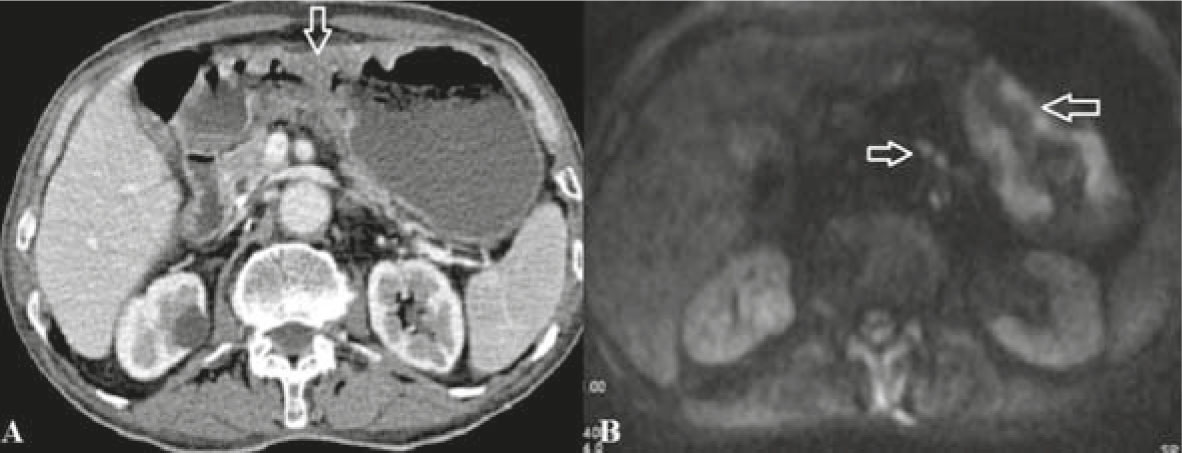
(A, B) T2N2M0 Axial MDCT and b800 DWI. (A) Axialcontrast-enhanced MDCT and (B) b800 DWI demonstrate wall thickness in the gastric corpus withdiffusion restrictions, andadjacent lymphadenopathies (mm sized) on DWI.
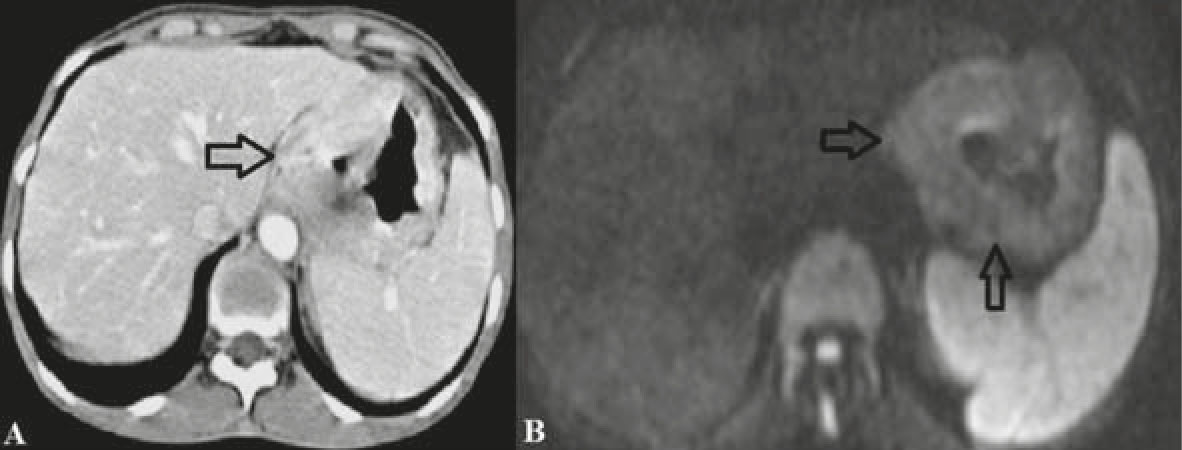
(A, B) T3N1MO Axial MDCT and DWI. (A) Axialcontrast-enhanced MDCT and (B) DWI demonstratewall thickness at gastric corpus and diffusion restriction and adjacent lymphadenopathieswere observed (arrow).
Table 1
Effectiveness of DWI and MDCT in T staging according to surgical pathology result
| T2 | T3 | T4 | ||
|---|---|---|---|---|
| Sensitivity | 72.7% | 71.0% | 55.6% | |
| Specificity | 77.5% | 80.0% | 92.9% | |
| DWI | PPV | 47.1% | 84.6% | 62.5% |
| NPV | 91.2% | 64.0% | 90.7% | |
| Kappa (p) | 0.419 (0.002) | 0.488 (< 0.001) | 0.506 (< 0.001) | |
| Sensitivity | 63.6% | 74.2% | 66.7% | |
| Specificity | 77.5% | 80.0% | 95.2% | |
| MDCT | PPV | 43.8% | 85.2% | 75.0% |
| NPV | 88.6% | 66.7% | 93.0% | |
| Kappa (p) | 0.353 (0.009) | 0.523 (< 0.001) | 0.647 (< 0.001) | |
CT = Computed Tomography; DWI = Diffusion Weighted Imaging; NPV = Negative Predictive Value; PPV= Positive Predictive Value
Table 2
Efficiency of DWI and MDCT in N staging according to surgical pathology result
| N1 | N2 | N3 | ||
|---|---|---|---|---|
| Sensitivity | 75.0% | 79.3% | 60.0% | |
| Specificity | 84.6% | 77.3% | 97.6% | |
| DWI | PPV | 60.0% | 82.1% | 85.7% |
| NPV | 91.7% | 73.9% | 90.9% | |
| Kappa (p) | 0.549 (< 0.001) | 0.563 (< 0.001) | 0.649 (< 0.001) | |
| Sensitivity | 66.7% | 69.0% | 50.0% | |
| Specificity | 82.1% | 68.2% | 90.2% | |
| MDCT | PPV | 53.3% | 74.1% | 55.6% |
| NPV | 88.9% | 62.5% | 88.1% | |
| Kappa (p) | 0.448 (0.001) | 0.367 (0.008) | 0.418 (0.003) | |
CT = Computed Tomography; DWI = Diffusion Weighted Imaging; NPV = Negative Predictive Value; PPV= Positive Predictive Value