
Table 1
Imaging and laboratory results of all patients. Reported baseline treatment was initiated several days after baseline PET/CT
| No | Disease status | Date of baseline (B) and follow up (FU) examination | Time to control exam (months) | B/FU praepubic to liver uptake ratio | B/FU FW (mm/h) | B/FU CRP (mg/dL) | B/FU treatment (mg/day) | B/ FU region of positivity of other PMR areas (target-to- liver ratio) | B/FU vascular positivity |
|---|---|---|---|---|---|---|---|---|---|
| 1 | R | 11-18-2014 | 4.0 | 1.134 | 44 | 23 | P 15 | S 2.23, H 1.25, Scl 1.13, Isch 1.45 | no positivity |
| 3-20-2015 | 0.576 | 16 | 1.4 | P 5 | H 1.11 | no positivity | |||
| 2 | N | 2-23-2010 | 48.7 | 1.234 | 120 | 49 | P 15 | S 1.65, H 1.24, Scl 1.24, Isch 1.17, L 1.14 | no positivity |
| 3-15-2014 | 0.812 | 26 | 16.9 | M 8 | no positivity | no positivity | |||
| 3 | N | 9-1-2014 | 3.2 | 2.148 | 120 | 137 | P 60 | S 1.87, Scl 1.45, H 2.31, Isch 1.65, L 1.12, Th 1.14, C 1.24 | no positivity |
| 12-8-2014 | 0.992 | 35 | 16.7 | P 10 | S 1.36 | no positivity | |||
| 4 | N | 7-24-2010 | 6.1 | 1.891 | 120 | 56.8 | P 40 | S 1.78, Scl 1.54, H 1, Isch 2.21, L 1.08 | no positivity |
| 1-25-2011 | 0.345 | 30 | 5.7 | P 2.5 | no positivity | no positivity | |||
| 5 | N | 3-13-2014 | 12.0 | 1.772 | 60 | 28.5 | P 20 | S 2.02, H 1.47, Scl 1.24, Isch 2.02, L 1.23 | V3/6 |
| 3-13-2015 | 0.987 | 7 | 1 | P 0 | no positivity | V1/6 no positivity | |||
| 6 | N | 10-14-2013 | 16.9 | 1.298 | 54 | 45 | P 20 | S1.78, H1.88, Scl 1.95, L 1.25, Isch 1.16 | |
| 3-13-2015 | 0.537 | 6 | 5.3 | P 2.5 | no positivity | no positivity | |||
| 7 | R | 1-3-2014 | 13.1 | 1.302 | 77 | 78.3 | M 16 | S 1.78, H 1.87, Scl 1.35, Isch 1.65, L 1.12 | V4/6 |
| 2-6-2015 | 0.403 | 5 | 1.9 | M 2 | no positivity | no positivity | |||
| 8 | N | 6-9-2012 | 33.1 | 1.835 | 50 | 76 | P 30 | S 2.21, H 2.16, Scl 1.8, Isch 1.78, L 1.2 | V4/6 |
| 3-13-2015 | 0.54 | 14 | 3.1 | P 0 | H 1.23 | V2/6 | |||
| 9 | N | 6-3-2015 | 3.1 | 1.502 | 60 | 41.5 | P 15 | S 2.36, H 2.24, Scl 2.03, Isch 2.04, C 1.11 | no positivity |
| 9-4-2015 | 0.76 | 16 | 13.4 | P 10 | no positivity | no positivity no positivity | |||
| 10 | N | 1-8-2014 | 21.7 | 1.209 | 80 | 78.3 | P 60 | S 1.84, H1.78, Scl 1.69, Isch 1.57, L 1.23 | |
| 10-30-2015 | 0.395 | 10 | 2.5 | P 7.5 | no positivity | no positivity | |||
| 11 | R | 3-4-2015 | 8.1 | 1.546 | 62 | 16.5 | M 48 + MTX 10/ week M 4 + | S 2.66, H 2.74, Scl 2.0, Isch 1.72, C 1.47, L 1.48 | V5/6 |
| 11-5-2015 | 0.811 | 30 | 3.3 | MTX 10/ week | H 1.14, C 1.08, S 1.11, Scl 1.07 S 2.27, H 2.06, Scl 2.16, Isch | V3/6 | |||
| 12 | N | 2-6-2015 | 8.3 | 1.789 | 120 | 98.7 | M 32 | 3.03, L 1.45 | no positivity |
| 10-16-2015 | 0.97 | 40 | 7.5 | M 8 | Scl 1.14, Isch 1.21 | no positivity | |||
| 13 | N | 1-23-2015 | 14 | 1.123 | 70 | 67.5 | P 15 | S 1.78, H 1.87, Scl 1.69, Isch 1.57, L 1.24 | no positivity |
| 3-24-2016 | 0.441 | 6 | 1.4 | P 5 | no positivity | no positivity no positivity | |||
| 14 | N | 9-16-2015 | 5.8 | 1.282 | 74 | 52 | P 20 | S 2.44, H 3.04, Scl 2.07, L 1.21 | |
| 3-9-2016 | 0.41 | 24 | 3.2 | P 7.5 | no positivity | no positivity | |||
| 15 | N | 10-26-2015 | 3.2 | 1.892 | 80 | 118.8 | P 30 | S 2.93, H 2.97, Isch 3.22, C 1.44, L 1.24, Th 1.17, Scl 1.79 | V4/6 |
| 2-1-2016 | 0.678 | 5 | 1.3 | P20 | no positivity | no positivity |
B/C = baseline and control; C, L, Th = cervical, lumbal, thoracic interspinous space; FW = Fåhræus-Westergren test; H = hip; M = methylprednisolone; Isch = ischiogluteal bursae; MTX = methotrexate; N = newly diagnosed; P = prednisone; R = relapse; S = shoulder; Scl = sternoclavicular joint; V = vascular uptake with number indicating presence in regions from 6 measured
Table 2
Patients’ baseline characteristics
| Characteristics | Numbers (%) n= 15 (100%) |
|---|---|
| Sex, n (%) | |
| females | 10 (66.7 %) |
| males | 5 (33.3 %) |
| Age at the disease onset | |
| median (min-max) | 70 years (53-78) |
| Time to follow up exam | |
| median (min-max) | 8 months (3-49) |
Table 3
Changes in analysed laboratory parameters between baseline and follow up examination
| Baseline median (min-max) | Follow up median (min-max) | p-value median (min-max) | |
|---|---|---|---|
| CRP | 57 mg/l (17-137) | 3 mg/l (1-17) | 0.001 |
| FW | 74 mm/hod (44-120) | 16 mm/hod (5-40) | 0.001 |
Table 4
Nuclear medicine data at baseline and follow up examination
| Baseline median (min-max) | Follow up median (min-max) | p-value median (min-max) | |
|---|---|---|---|
| 18F-FDG | 366 MBq (327-434) | 362 MBq (301-400) | 0.271 |
| Praepubic / liver 18F-FDG uptake | 1.50 (1.12-2.15) | 0.58 (0.35-0.99) | 0.001 |
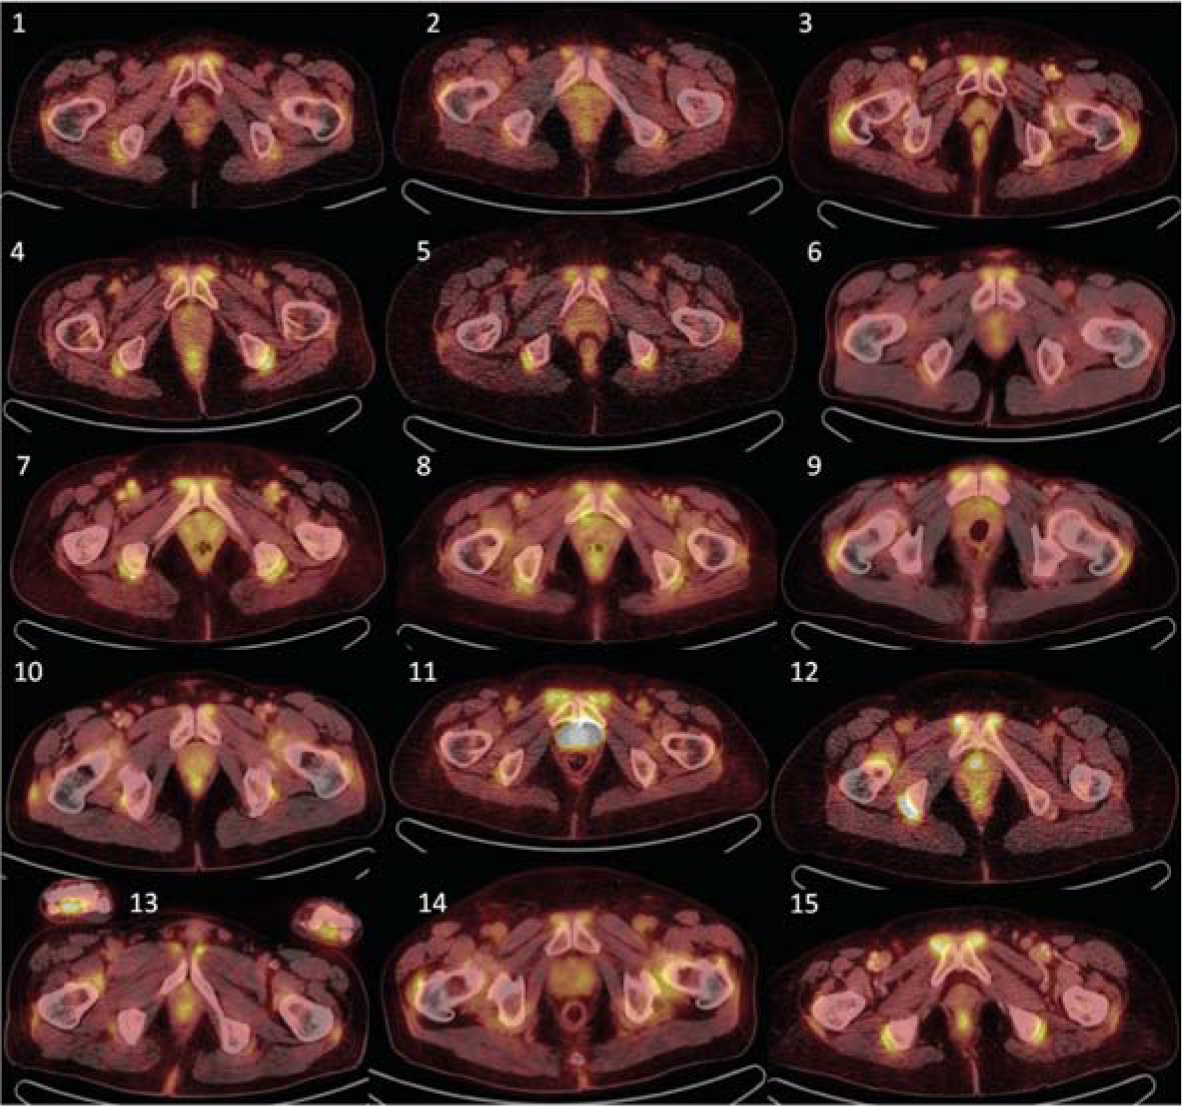
Initial 18FDG-PET/CT examination of all 15 examined patients, showing transversal planes through maximal praepubic uptake. Visually detectable accumulation can be observed in all patients.
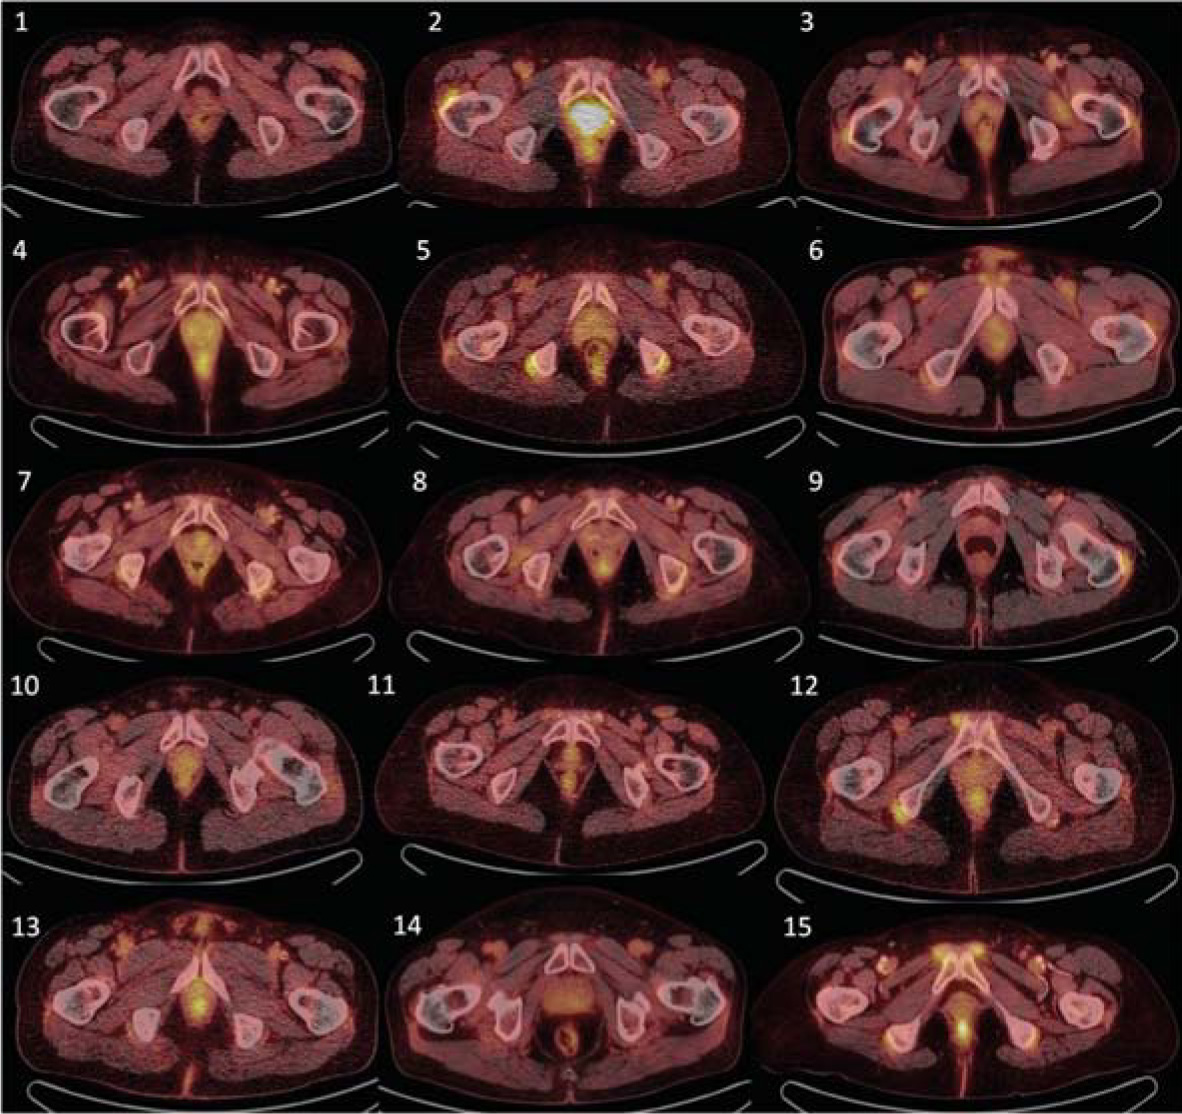
Control 18FDG-PET/CT examination showing corresponding transversal slices as in Figure 1. Compared with Figure 1, decrease or complete diminishment of 18FDG accumulation is observable in all patients.