
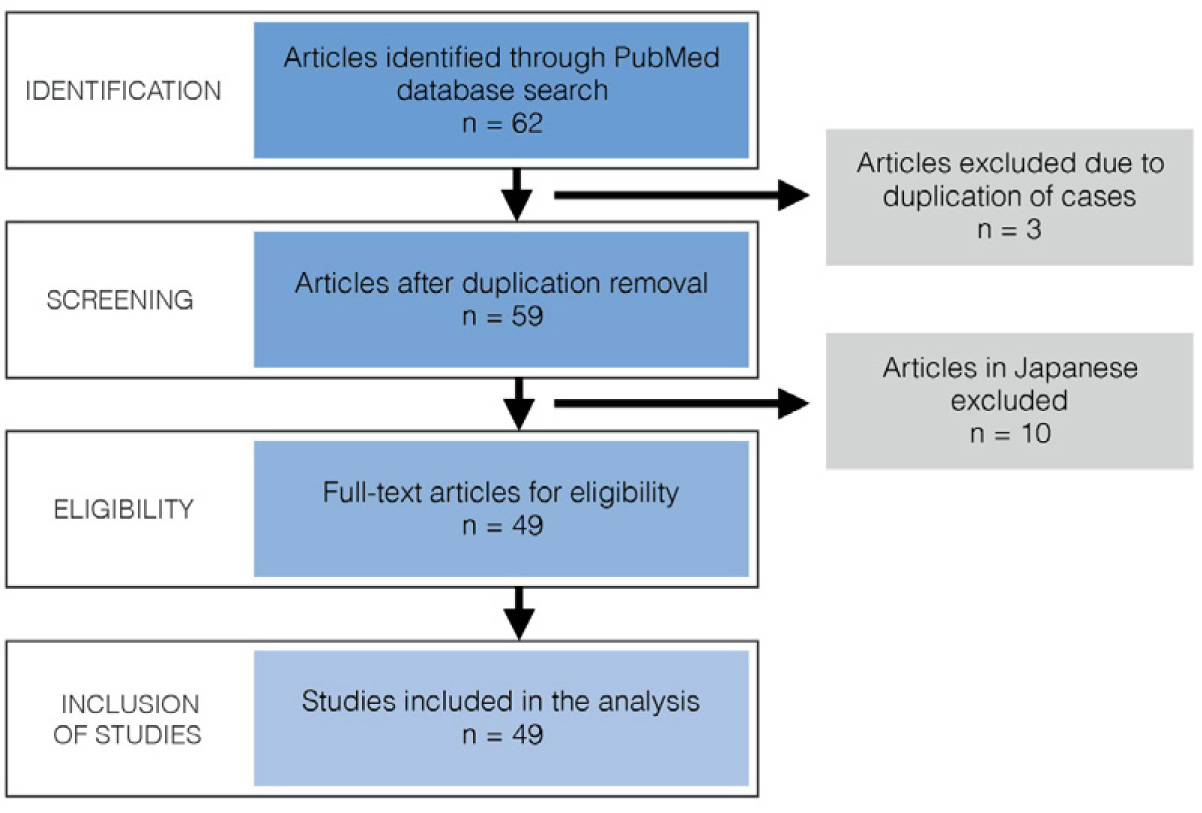
Flow chart of identification, screening, eligibility and inclusion of studies.
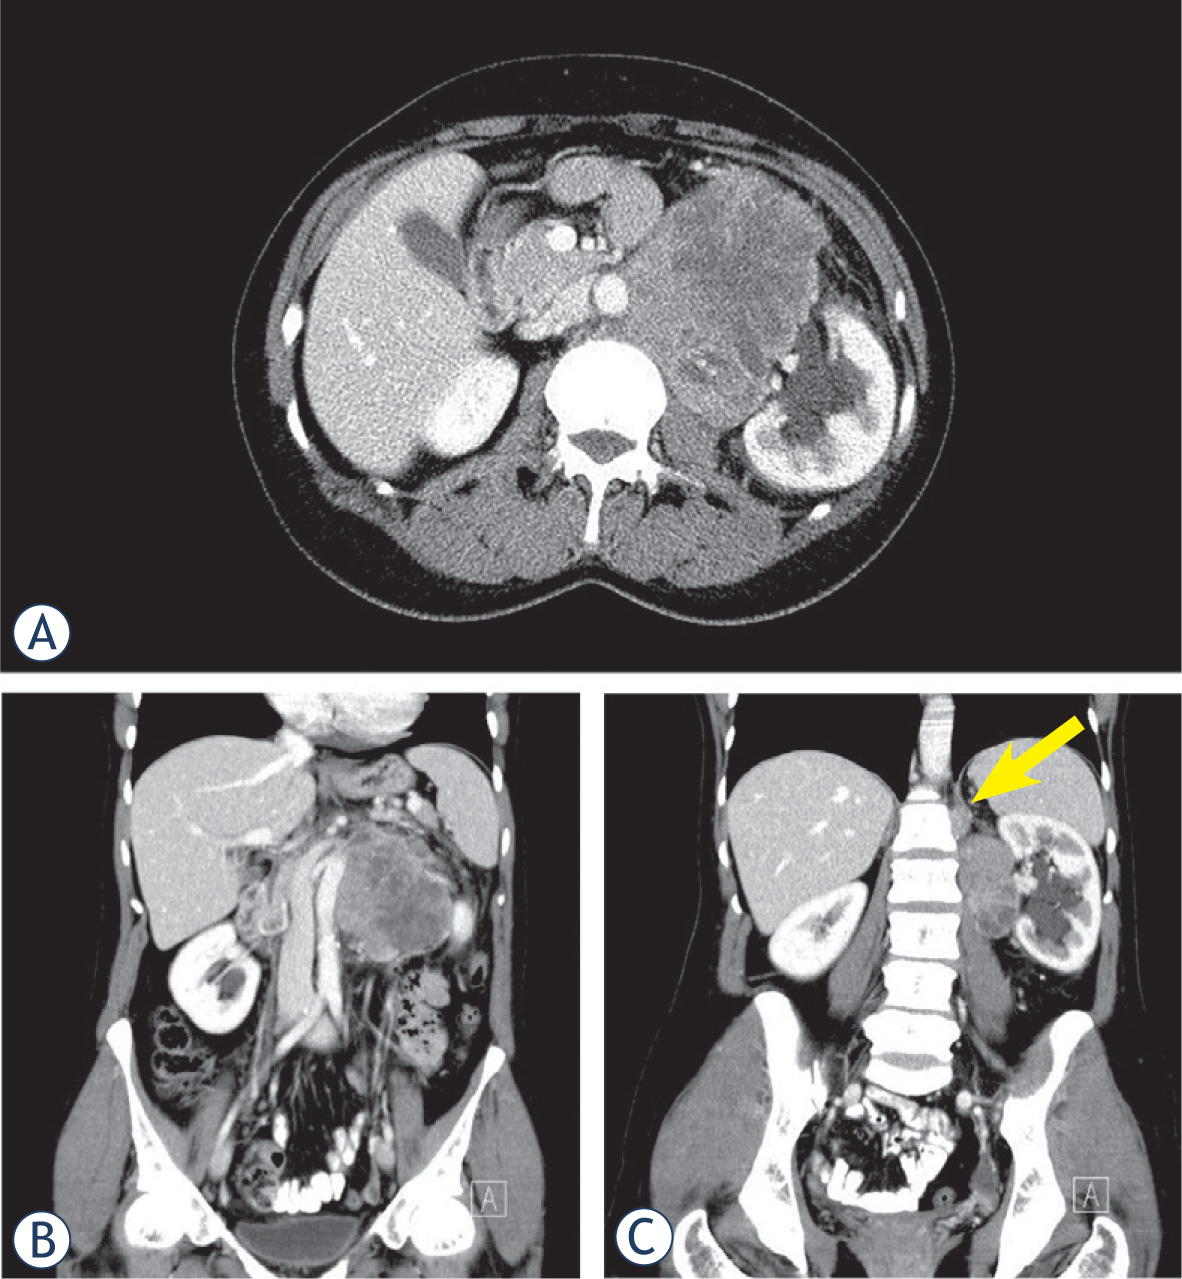
Enhanced computed tomography showing retroperitoneal tumour, interposed between the aorta and the left kidney, axial (A) and coronal plane (B). Separately removed satellite node in coronal plane, arrow (C).
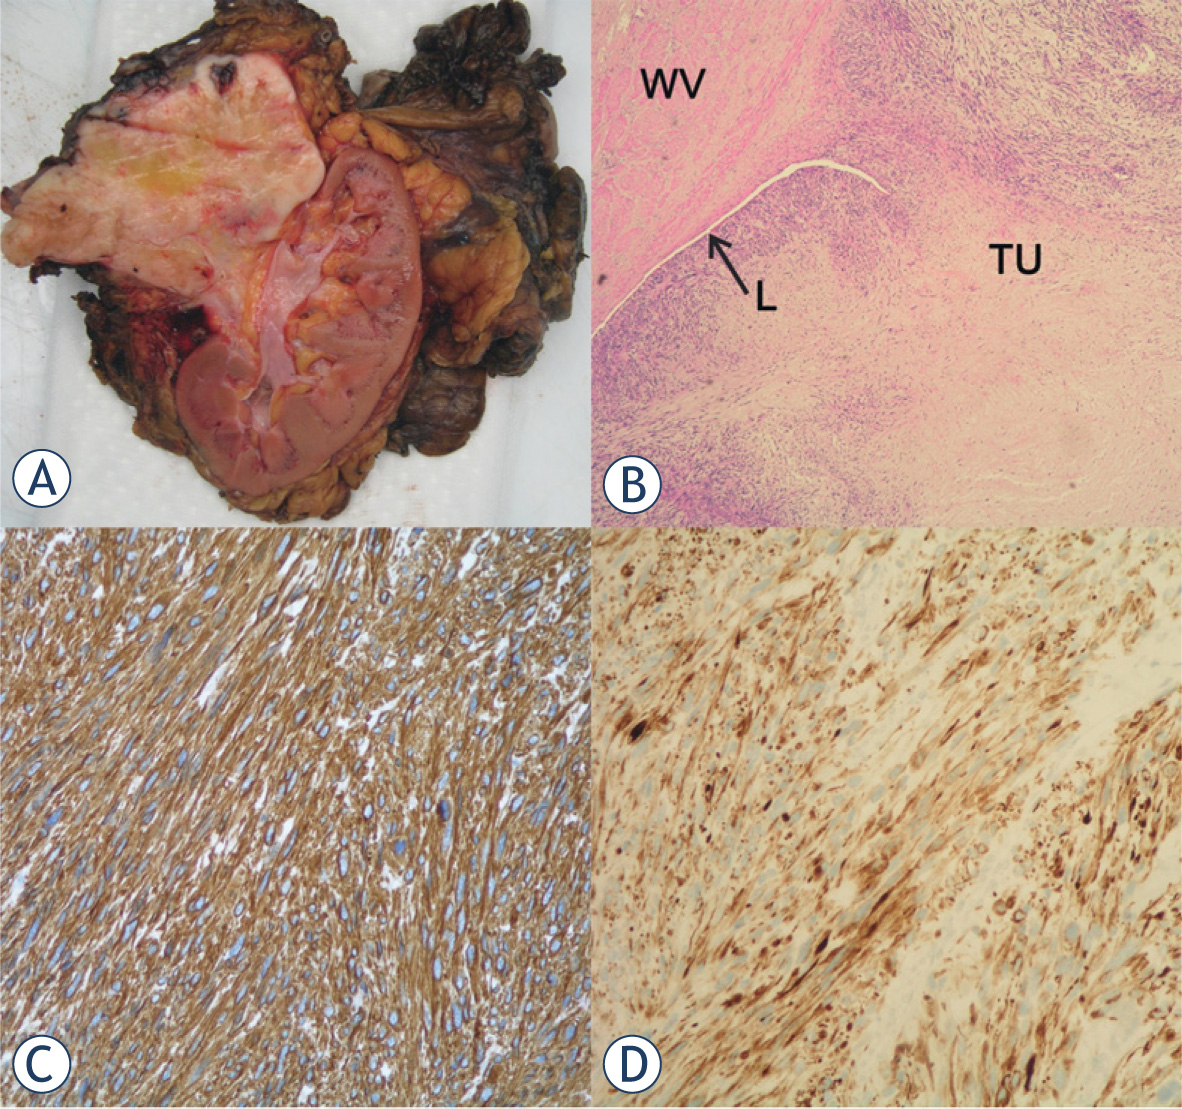
(A) A gross specimen of renal vein leiomyosarcoma. The tumour is well-circumscribed, is lying in the renal hilum, without infiltration of the renal parencyma. (B) Hematoxylin & Eosin stain section. Showing the vascular lumen (L) and the tumour (TU) growing from the wall of the renal vein (WV). Immunohistochemical stains for SMA (C) and desmin (D) showing strong positivity.
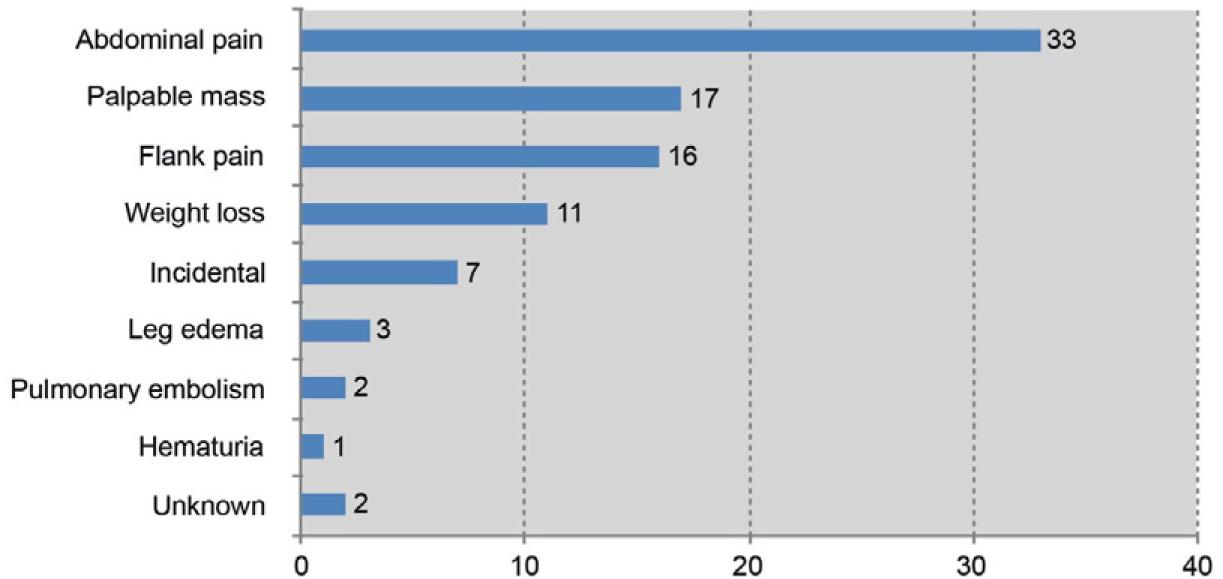
Clinical presentation of leiomyosarcoma of the renal vein cases.
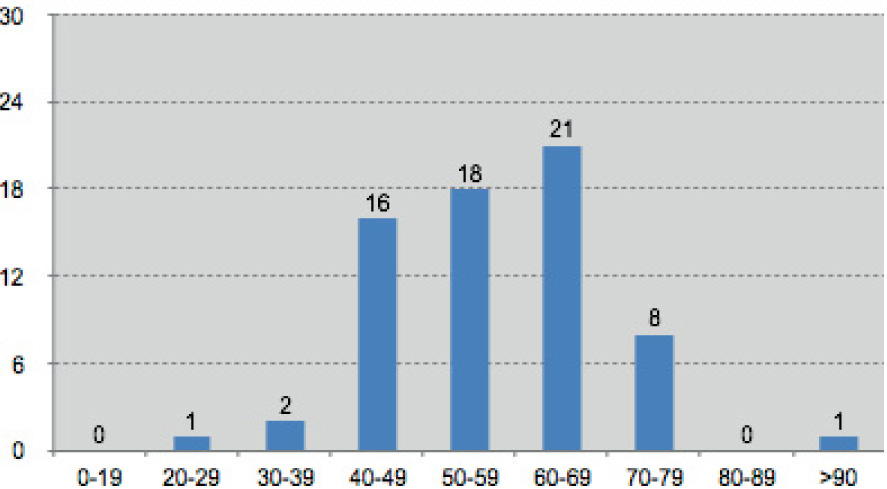
Age distribution of leiomyosarcoma of the renal vein patients.
Table 1
Patients data and histologic variables, treatment modalities and disease progression
| Characteristic | Subgroup | Value (n = 67) | % |
|---|---|---|---|
| Age at diagnosis (year) | Mean | 56.6 | |
| Range | 27–93 | ||
| Gender | Female | 51 | 76.1 |
| Male | 16 | 23.9 | |
| Side | Left | 46 | 68.7 |
| Right | 21 | 31.3 | |
| Size (cm) | Mean | 8.9 | |
| Range | 3.5–25 | ||
| Tumour thrombus extension | IVC | 9 | 13.4 |
| Preoperative biopsy | Histology | 9 | 13.4 |
| Fine needle aspiration | 2 | 3.0 | |
| No biopsy | 56 | 83.6 | |
| Tumour grade | G1 | 6 | 9.0 |
| G2 | 8 | 11.9 | |
| G3 | 14 | 20.9 | |
| Unknown | 39 | 58.2 | |
| Surgical margins | Negative | 15 | 22.4 |
| Positive | 3 | 4.5 | |
| Unknown | 49 | 73.1 | |
| Operation | Nephrectomy | 60 | 89.6 |
| Tumorectomy | 4 | 6.0 | |
| Compartment resection | 2 | 3.0 | |
| No operation | 1 | 1.5 | |
| Preoperative treatment | Embolization | 3 | 4.5 |
| ChT | 1 | 1.5 | |
| RT + ChT | 2 | 3.0 | |
| Intraoperative treatment | RT | 1 | 1.5 |
| Postoperative treatment | RT | 7 | 10.4 |
| ChT | 9 | 13.4 | |
| ChT + RT | 1 | 1.5 | |
| Immunotherapy | 1 | 1.5 | |
| Disease progression | LR | 3 | 4.5 |
| M | 20 | 29.9 | |
| LR + M | 10 | 14.9 | |
| Total | 33 | 49.3 | |
| Site of dissemination | Liver | 17 | 25.4 |
| Lungs | 16 | 23.9 | |
| Bone | 8 | 11.9 | |
| Soft tissue | 4 | 6.0 |
ChT = chemotherapy; G = grade; IVC = inferior vena cava; LR = local recurrence; M = metastases; RT = radiotherapy
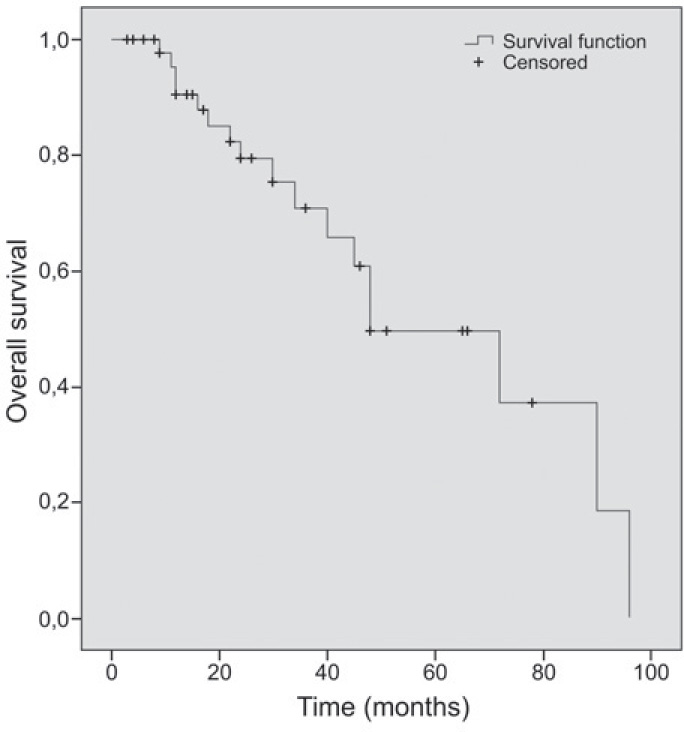
Kaplan-Meier curve of overall freesurvival.
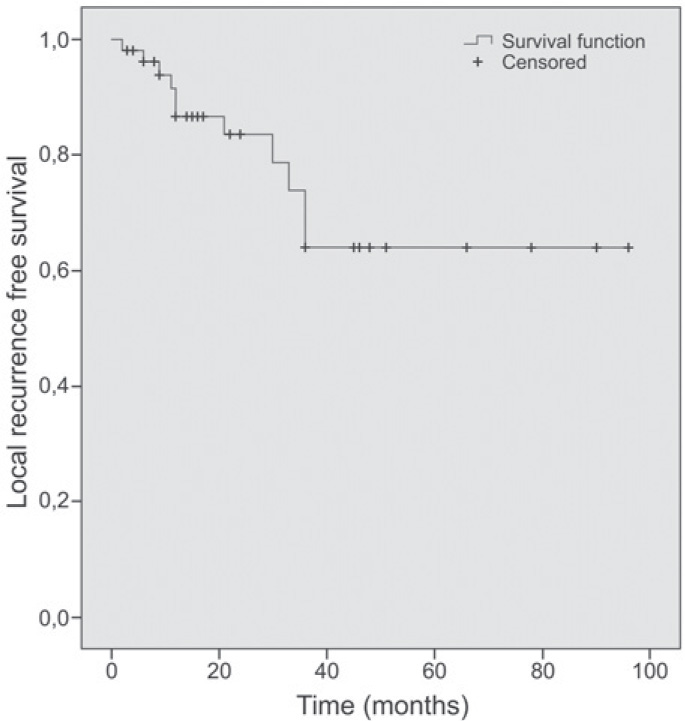
Kaplan-Meier curve of local recurrence free survival.
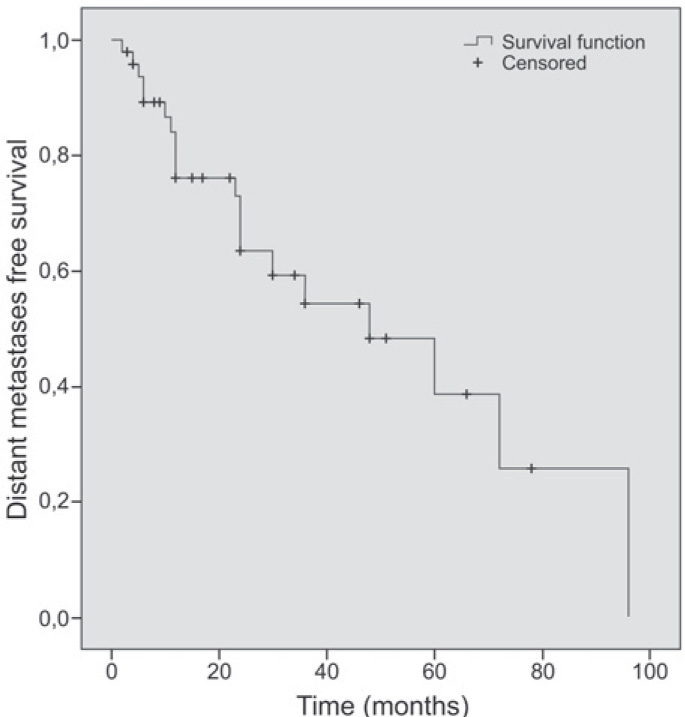
Kaplan-Meier curve of distant metastases free survival.
Table 2
Univariate analysis of overall, local recurrence free and distant metastases free survival (log-rank)
| Characteristic | Subgroup | OVERALL SURVIVAL | LOCAL RECURRENCE FREE SURVIVAL | ||||
|---|---|---|---|---|---|---|---|
| Alive (n = 39) | Dead (n = 17) | p-value | No LR (n = 45) | LR (n = 11) | p-value | ||
| Age | ≤ 50 | 13 | 5 | 0.285 | 15 | 3 | 0.519 |
| 50 | 26 | 12 | 30 | 8 | |||
| Gender | F | 32 | 15 | 0.812 | 38 | 9 | 0.993 |
| M | 7 | 2 | 7 | 2 | |||
| Side | L | 29 | 9 | 0.448 | 31 | 7 | 0.987 |
| R | 10 | 8 | 14 | 4 | |||
| Weight loss | Y | 5 | 6 | 0.414 | 9 | 2 | 0.734 |
| N | 34 | 11 | 36 | 9 | |||
| Palpable mass | Y | 9 | 6 | 0.581 | 12 | 4 | 0.562 |
| N | 30 | 11 | 34 | 9 | |||
| Operation | Nephrectomy | 35 | 15 | 0.543 | 41 | 9 | 0.562 |
| Tumorectomy | 2 | 2 | (nephrectomy or tumorectomy vs. compartment) | 2 | 2 | ||
| Compartment | 2 | 0 | 2 | 0 | |||
| Intracaval luminal extension | Y | 5 | 3 | 0.340 | 4 | 4 | 0.016 |
| N | 34 | 14 | 41 | 7 | |||
| Tumour size | ≤ 10 cm | 23 | 10 | 0.485 | 28 | 5 | 0.219 |
| > 10 cm | 11 | 3 | (≤ 10 cm vs. > 10 cm) | 11 | 3 | (≤ 10 cm vs. > 10 cm) | |
| Unknown | 5 | 4 | 6 | 3 | |||
| Grade | 1 | 4 | 2 | 0.265 (1 vs. 2 or 3) | 6 | 0 | 0.05 (1 vs 2 or 3) |
| 2 or 3 | 13 | 6 | 12 | 7 | |||
| Unknown | 22 | 9 | 27 | 4 | |||
| Margins | Negative | 14 | 1 | 0.014 (neg. vs. pos.) | 12 | 3 | 0.096 (neg. vs. pos.) |
| Positive | 1 | 1 | 0 | 2 | |||
| Unknown | 24 | 15 | 33 | 6 | |||
| Mitoses/10hpf | <10 | 8 | 2 | 0.782 (<10 vs. ≥10) | 8 | 2 | 0.244 (<10 vs. ≥10) |
| ≥10 | 2 | 1 | 1 | 2 | |||
| Unknown | 29 | 14 | 36 | 7 | |||
| Neoadjuvant/adjuvant chemotherapy | Y | 8 | 3 | 0.987 | 7 | 4 | 0.337 |
| N | 31 | 14 | 38 | 7 | |||
| Neoadjuvant/adjuvant raditherapy | Y | 6 | 4 | 0.165 | 8 | 2 | 0.975 |
| N | 33 | 13 | 37 | 9 | |||
F = female; L = left; LR = local recurrence; M = male; N = No; R = right; Y = Yes
| Characteristic | Subgroup | DISTAN1 METASTASES FREE SURVIVAL | ||
|---|---|---|---|---|
| No DM (n = 31) | DM (n = 25) | p-value | ||
| Age | ≤ 50 | 9 | 9 | 0.805 |
| > 50 | 22 | 16 | ||
| Gender | F | 27 | 20 | 0.221 |
| M | 4 | 5 | ||
| Side | L | 19 | 19 | 0.138 |
| R | 12 | 6 | ||
| Weight loss | Y | 2 | 9 | 0.087 |
| N | 29 | 16 | ||
| Palpable mass | Y | 5 | 10 | 0.277 |
| N | 26 | 15 | ||
| Operation | Nephrectomy | 27 | 23 | 0.336 |
| Tumorectomy | 3 | 1 | (nephrectomy or tumorectomy vs. compartment) | |
| Compartment | 1 | 1 | ||
| Intracaval luminal extension | Y | 4 | 4 | 0.284 |
| N | 27 | 21 | ||
| Tumour size | ≤ 10 cm | 21 | 12 | 0.210 |
| > 10 cm | 7 | 7 | (≤ 10 cm vs. > 10 cm) | |
| Unknown | 3 | 6 | ||
| Grade | 1 | 4 | 2 | 0.131 (1 vs. 2 or 3) |
| 2 or 3 | 9 | 10 | ||
| Unknown | 18 | 13 | ||
| Margins | Negative | 10 | 5 | 0.815 (neg. vs. pos.) |
| Positive | 1 | 1 | ||
| Unknown | 20 | 19 | ||
| Mitoses/10hpf | <10 | 9 | 1 | 0.266 (<10 vs. ≥10) |
| ≥10 | 1 | 2 | ||
| Unknown | 21 | 22 | ||
| Neoadjuvant/adjuvant chemotherapy | Y | 5 | 6 | 0.683 |
| N | 26 | 19 | ||
| Neoadjuvant/adjuvant radiotherapy | Y | 5 | 5 | 0.087 |
| N | 26 | 20 | ||
DM = distant metastases; F = female; L = left; M = male; N = No; R = right; Y = Yes