
Setup errors by the specified threshold
| ML error (%) | SI error (%) | AP error (%) | |
|---|---|---|---|
| < 1.0 mm | 3549 (49.1) | 2471 (34.2) | 525 (7.3) |
| 1.0~1.9 mm | 2315 (32.0) | 2076 (28.7) | 939 (13.0) |
| 2.0~2.9 mm | 925 (12.8) | 1390 (19.2) | 1492 (20.6) |
| 3.0~3.9 mm | 314 (4.3) | 729 (10.1) | 1800 (24.9) |
| 4.0~4.9 mm | 85 (1.2) | 330 (4.6) | 1310 (18.1) |
| ≥ 5.0 mm | 45 (0.6) | 237 (3.3) | 1167 (16.1) |
Patient characteristics (n = 217)
| Variable | Number (%) | |
|---|---|---|
| Age | ||
| Median | 46 | |
| Range | 17–76 | |
| Sex | ||
| Male | 160 | (73.7) |
| Female | 57 | (26.3) |
| T stage | ||
| 1 | 97 | (44.7) |
| 2 | 32 | (14.7) |
| 3 | 50 | (23.0) |
| 4 | 38 | (17.5) |
| N stage | ||
| 0 | 51 | (23.5) |
| 1 | 67 | (30.9) |
| 2 | 67 | (30.9) |
| 3a | 18 | (8.3) |
| 3b | 15 | (6.9) |
| AJCC stage | ||
| I | 29 | (13.4) |
| II | 47 | (21.7) |
| III | 76 | (35.0) |
| IVA | 32 | (14.7) |
| IVB | 33 | (15.2) |
| Chemotherapy | ||
| No | 27 | (12.4) |
| Yes | 190 | (87.6) |
| Fraction | ||
| 33 (2.12 Gy/fraction) | 182 | (83.9) |
| 35 (2 Gy/fraction) | 35 | (16.1) |
Setup error by clinical factors
| ML error | SI error | AP error | |
|---|---|---|---|
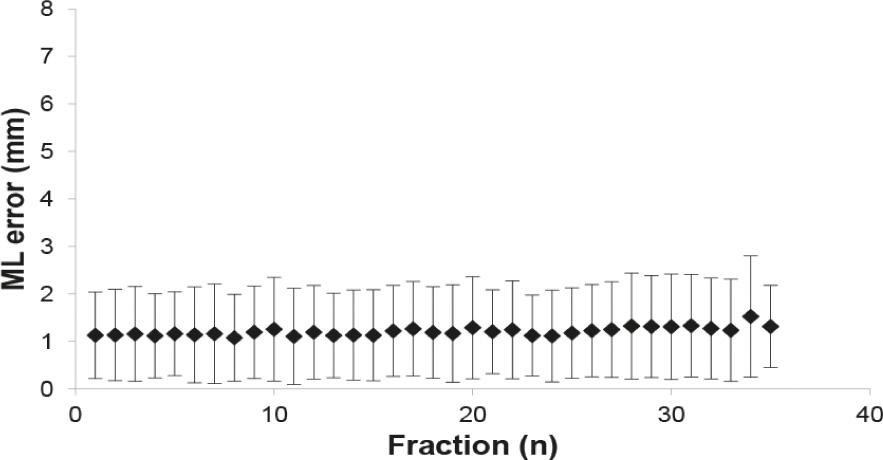
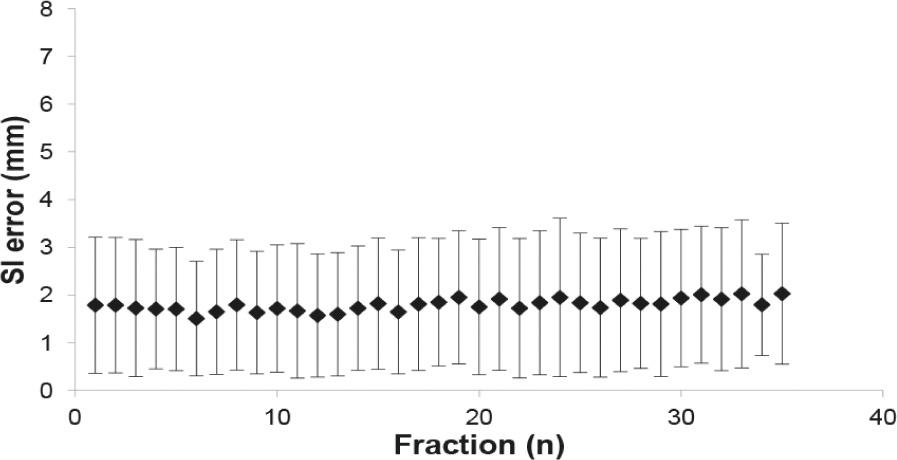
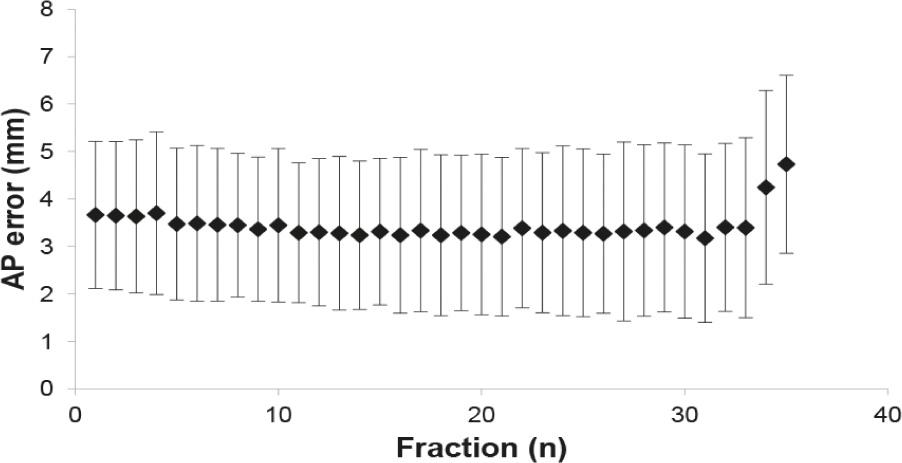
| Overall | 1.2 ± 0.6 | 1.8 ± 0.8 | 3.4 ± 1.4 |
| T stage | |||
| 1,2 (n = 129) | 1.2 ± 0.6 | 1.8 ± 0.9 | 3.3 ± 1.5 |
| 3,4 (n = 88) | 1.1 ± 0.5 | 1.7 ± 0.8 | 3.5 ± 1.3 |
| p value | 0.241 | 0.814 | 0.414 |
| N stage | |||
| 0, 1 (n = 117) | 1.1 ± 0.6 | 1.7 ± 0.8 | 3.4 ± 1.3 |
| 2, 3a, 3b (n = 100) | 1.2 ± 0.6 | 1.9 ± 0.9 | 3.4 ± 1.5 |
| p value | 0.133 | 0.239 | 0.890 |
| BMI | |||
| < 25 (n = 138) | 1.2 ± 0.6 | 1.7 ± 0.8 | 3.2 ± 1.3 |
| ≥ 25 (n = 79) | 1.2 ± 0.5 | 1.9 ± 0.9 | 3.6 ± 1.5 |
| p value | 0.845 | 0.177 | 0.053 |
| PTV | |||
| < 850 cc (n = 113) | 1.2 ± 0.7 | 1.9 ± 0.9 | 3.6 ± 1.5 |
| ≥ 850 cc (n = 104) | 1.2 ± 0.5 | 1.6 ± 0.7 | 3.2 ± 1.3 |
| p value | 0.292 | 0.021 | 0.03 |
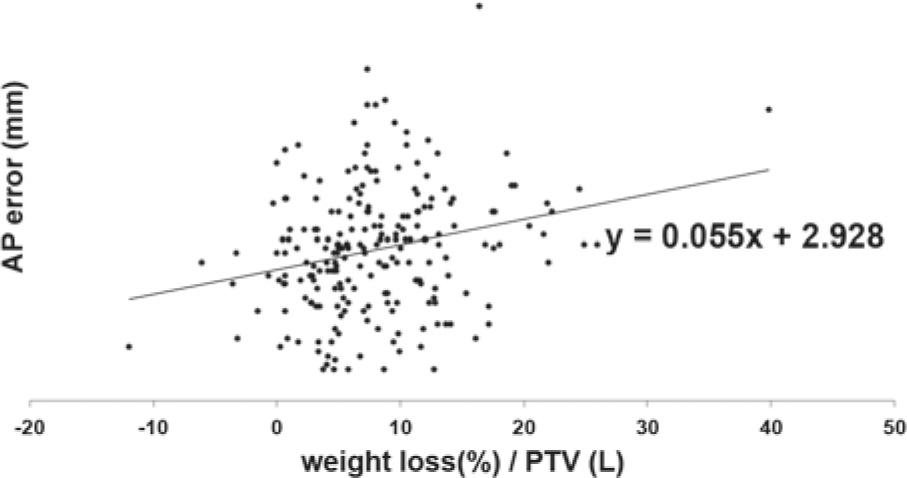
| Weight loss | |||
| ≤ 5% (n = 84) | 1.1 ± 0.4 | 1.6 ± 0.7 | 2.9 ± 1.1 |
| > 5% (n = 133) | 1.2 ± 0.6 | 1.9 ± 0.9 | 3.6 ± 1.5 |
| p value | 0.279 | 0.010 | <0.001 |