
Clinical and pathohistological characteristics of patients included in study
| Clinical and histopathological characteristics | CRC patients (N = 163) |
|---|---|
| Sex | |
| Male/female, N(%) | 92/71 (56.4/43.6) |
| Age at diagnosis | |
| Mean +/- SD | 67.28 +/- 11.44 |
| Stage of disease, N (%) | |
| I | 29 (17.8) |
| II | 81 (49.7) |
| III | 53 (32.5) |
| TNM staging | |
| Tumour, N (%) | |
| T1 | 8 (4.9) |
| T2 | 24 (14.7) |
| T3 | 120 (73.6) |
| T4 | 11 (6.7) |
| Lymph nodes, N (%) | |
| N0 | 110 (67.5) |
| N1 | 38 (23.3) |
| N2 | 15 (9.2) |
| Vital status (5.10.2015), N (%) | |
| dead | 65 (39.9) (42 due to CRC |
| progression, 23 other cause) | |
| alive | 98 (60.1) |
| Disease progression, N (%) | |
| yes | 46 (28.2) (42 dead, 4 alive) |
| no | 117 (71.8) |
| Disease progression according to stage, N (%) | |
| stage I | 5 (17.2) |
| stage II | 18 (22.2) |
| stage III | 23 (43.4) |
| Clinical characteristics, N (%) | |
| more than 12 lymph nodes resected | 70 (42.9) |
| adjuvant therapy | 41 (25.2) |
| Differentiation grade, N (%) | |
| I | 66 (40.5) |
| II | 74 (45.4) |
| III | 21 (12.9) |
| no data | 2 (1.2) |
| Perineural invasion, N (%) | |
| yes | 13 (8.0) |
| no | 150 (92.0) |
| Lymphovascular invasion, N (%) | |
| yes | 27 (16.6) |
| no | 136 (83.4) |
Associations between selected SNPs and clinico-histopathological characteristics of patients
| TNM staging | Grade of differentiation | Perineural invasion | Lymphovascular invasion | |||||||||||
|---|---|---|---|---|---|---|---|---|---|---|---|---|---|---|
| Gene/ SNP ID | Frequency | T1+T2 | T3+T4 | N0 | N1+N2 | 1+2 | 3 | No | Yes | No | Yes | |||
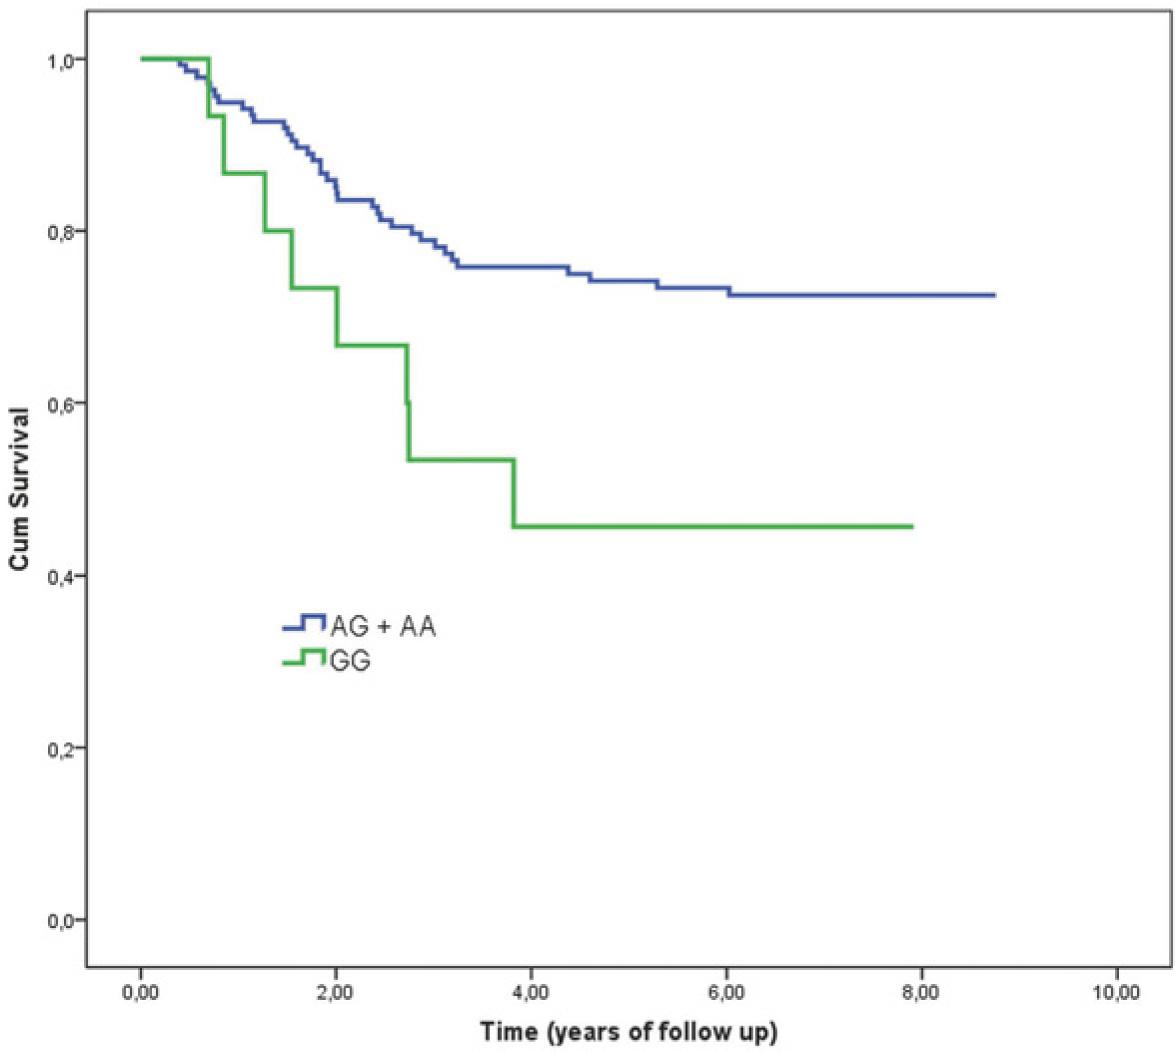
| CXCL12 rs1801157 | AA | 4.76 | 0.0 | 5.9 | 7.3 | 0.0 | 4.8 | 5.3 | 5.2 | 0.0 | 5.8 | 0.0 | ||
| AG | 29.25 | 31.0 | 28.8 | 26.0 | 35.3 | 27.8 | 42.1 | 29.9 | 23.1 | 27.3 | 38.5 | |||
| GG | 65.99 | 69.0 | 65.3 | 66.7 | 64.7 | 67.5 | 52.6 | 64.9 | 76.9 | 66.9 | 61.5 | |||
| Statistical analysis | 0.346 | 0.096 | 1.000 | 1.000 | 0.354 | p-value | AA vs AG+GG | |||||||
| 1.261 | 1.573 | 0.900 | 1.102 | 1.228 | OR | |||||||||
| 1.159–1.373 | 1.388–1.783 | 0.102–7.916 | 1.045–1.162 | 1.135–1.329 | 95% CI | |||||||||
| 0.828 | 1.000 | 0.303 | 0.543 | 0.656 | p-value | AA+AG vs GG | ||||||||
| 0.814 | 0.960 | 0.556 | 1.860 | 0.820 | OR | |||||||||
| 0.340–1.948 | 0.471–1.958 | 0.210–1.471 | 0.488–7.089 | 0.342–1.967 | 95% CI | |||||||||
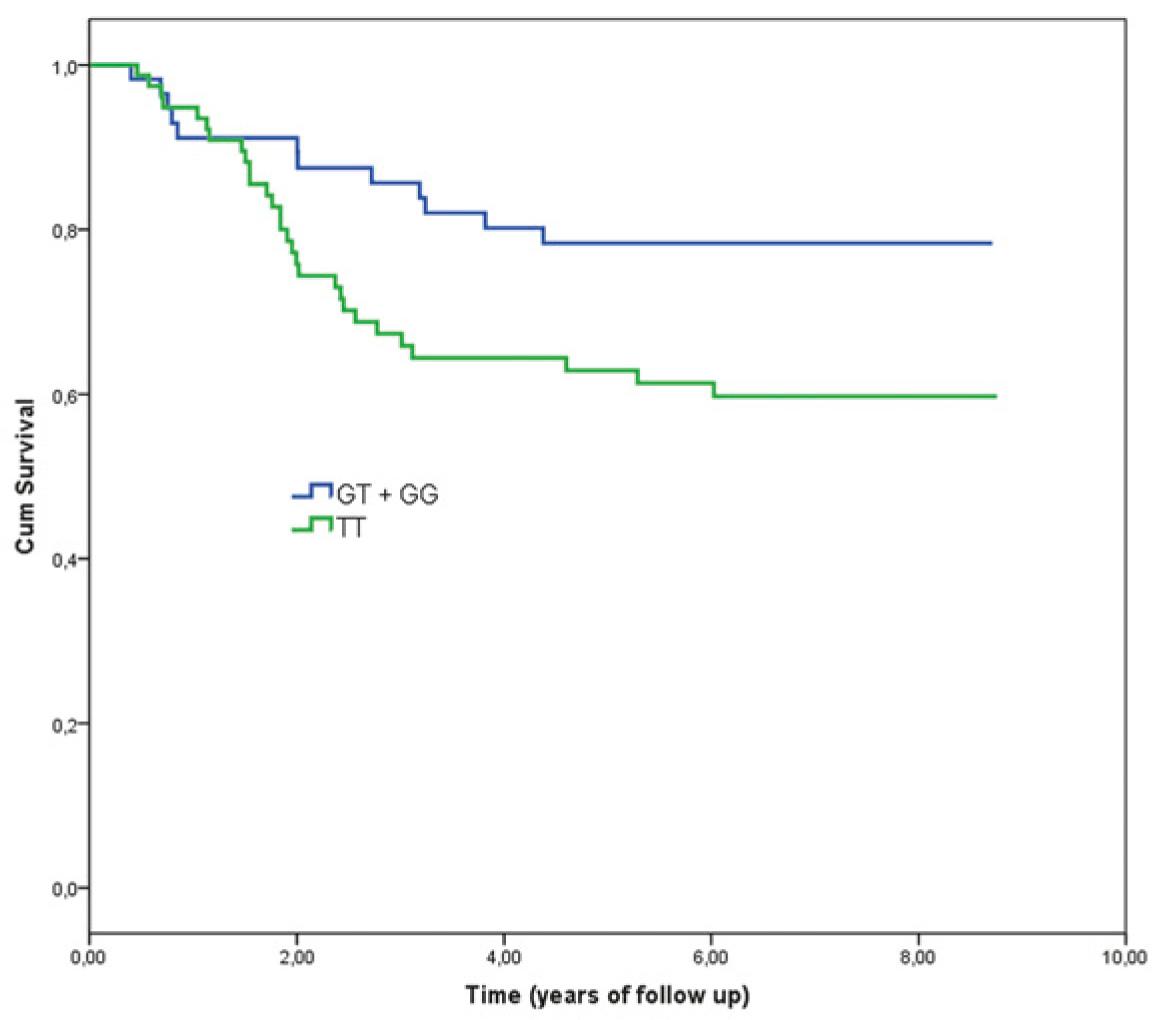
| MACC1 rs1990172 | GG | 5.84 | 12.0 | 4.5 | 7.8 | 2.1 | 5.2 | 5.3 | 5.6 | 7.7 | 7.1 | 0.0 | ||
| GT | 36.50 | 52.0 | 33.0 | 37.8 | 34.0 | 37.9 | 26.3 | 38.7 | 15.4 | 35.4 | 41.7 | |||
| TT | 57.66 | 36.0 | 62.5 | 54.4 | 63.8 | 56.9 | 68.4 | 55.6 | 76.9 | 57.5 | 58.3 | |||
| Statistical analysis | 0.024 | 0.363 | 1.000 | 0.560 | 0.350 | p-value | GG vs GT+TT | |||||||
| 2.963 | 1.477 | 0.982 | 0.718 | 1.229 | OR | |||||||||
| 1.202–7.301 | 0.715–3.050 | 0.112–8.641 | 0.081–6.338 | 1.131–1.334 | 95% CI | |||||||||
| 0.263 | 0.160 | 0.453 | 0.237 | 1.000 | p-value | GG+GT vs TT | ||||||||
| 3.880 | 2.918 | 1.641 | 2.657 | 1.034 | OR | |||||||||
| 0.463–32.516 | 0.649–13.119 | 0.583–4.620 | 0.697–10.127 | 0.523–2.525 | 95% CI | |||||||||
| MMP7 rs11568818 | AA | 27.27 | 28.6 | 27.0 | 28.1 | 25.5 | 27.9 | 26.3 | 26.7 | 33.3 | 27.7 | 25.0 | ||
| AG | 47.55 | 64.3 | 43.5 | 52.1 | 38.3 | 47.5 | 52.6 | 48.9 | 33.3 | 51.3 | 29.2 | |||
| GG | 25.17 | 7.1 | 29.6 | 19.8 | 36.2 | 24.6 | 21.1 | 24.4 | 33.3 | 21.0 | 45.8 | |||
| Statistical analysis | 1.000 | 0.843 | 1.000 | 0.736 | 1.000 | p-value | AA vs AG+GG | |||||||
| 1.084 | 1.141 | 1.082 | 0.729 | 1.151 | OR | |||||||||
| 0.433–2.713 | 0.517–2.521 | 0.362–3.234 | 0.207–2.573 | 0.420–3.152 | 95% CI | |||||||||
| 0.014 | 0.041 | 1.000 | 0.497 | 0.018 | p-value | AA+AG vs GG | ||||||||
| 5.457 | 2.296 | 0.818 | 1.547 | 3.182 | OR | |||||||||
| 1.226–24.284 | 1.054–5.002 | 0.252–2.654 | 0.437–5.479 | 1.273–7.952 | 95% CI | |||||||||
| RAD18 rs373572 | AA | 51.59 | 46.7 | 52.8 | 48.6 | 58.0 | 50.4 | 55.0 | 50.7 | 61.5 | 51.9 | 50.0 | ||
| AG | 38.22 | 33.3 | 39.4 | 41.1 | 32.0 | 39.3 | 35.0 | 39.6 | 23.1 | 38.2 | 38.5 | |||
| GG | 10.19 | 20.0 | 7.9 | 10.3 | 10.0 | 10.4 | 10.0 | 9.7 | 15.4 | 9.9 | 11.5 | |||
| Statistical analysis | 0.685 | 0.306 | 0.812 | 0.567 | 1.000 | p-value | AA vs AG+GG | |||||||
| 0.784 | 0.685 | 0.830 | 0.643 | 1.079 | OR | |||||||||
| 0.353–1.739 | 0.348–1.348 | 0.323–2.133 | 0.201–2.058 | 0.465–2.504 | 95% CI | |||||||||
| 0.085 | 1.000 | 1.000 | 0.624 | 0.731 | p-value | AA+AG vs GG | ||||||||
| 0.342 | 0.970 | 0.960 | 1.688 | 1.184 | OR | |||||||||
| 0.113–1.030 | 0.318–2.957 | 0.201–4.580 | 0.339–8.399 | 0.312–4.488 | 95% CI | |||||||||
Primer sequences used in PCR reaction, expected sizes of products, annealing temperatures, primer concentrations and genotyping method of selected SNPs; restriction enzymes and sizes of fragments after restriction for genotyping of SNPs rs1801157 (CXCL12) and rs1990172 (MACC1)
| Gene | SNP ID | Forward and reverse primer | Product size [bp] | Annealing temperature [°C] | Primer concentration [nM] | Genotyping method |
|---|---|---|---|---|---|---|
| CXCL12 | rs1801157 A/G | GTGGGATGGGATGGTGGAG CCTCAGCTCAGGGTAGCC | 109 | 60 | 650 | RFLP |
| MACC1 | rs1990172 G/T | CAGGGAAAGAAATGGTTATTGCA GGAAAAGGAGGGAAGCATGTG | 115 | 63 | 300 | RFLP |
| MMP7 | rs11568818 A/G | TGGAGTCAATTTATGCAGCAG CGAGGAAGTATTACATCGTTATTGG | 93 | 57 | 250 | HRM |
| RAD18 | rs373572 A/G | TGTGATTAACCTAGTGGTTATTTTCTT GCATCCTAGTCTTCTCTATATTTTCG | 85 | 60 | 300 | HRM |
| Gene | SNP ID | Restriction enzyme | Size of fragments after restriction [bp] | |||
| CXCL12 | rs1801157 | MspI | AA: 109, AG: 109+62+47, GG: 62+47 | |||
| MACC1 | rs1990172 | BseGI | GG: 80+35, GT: 105+80+35, TT: 105 | |||