
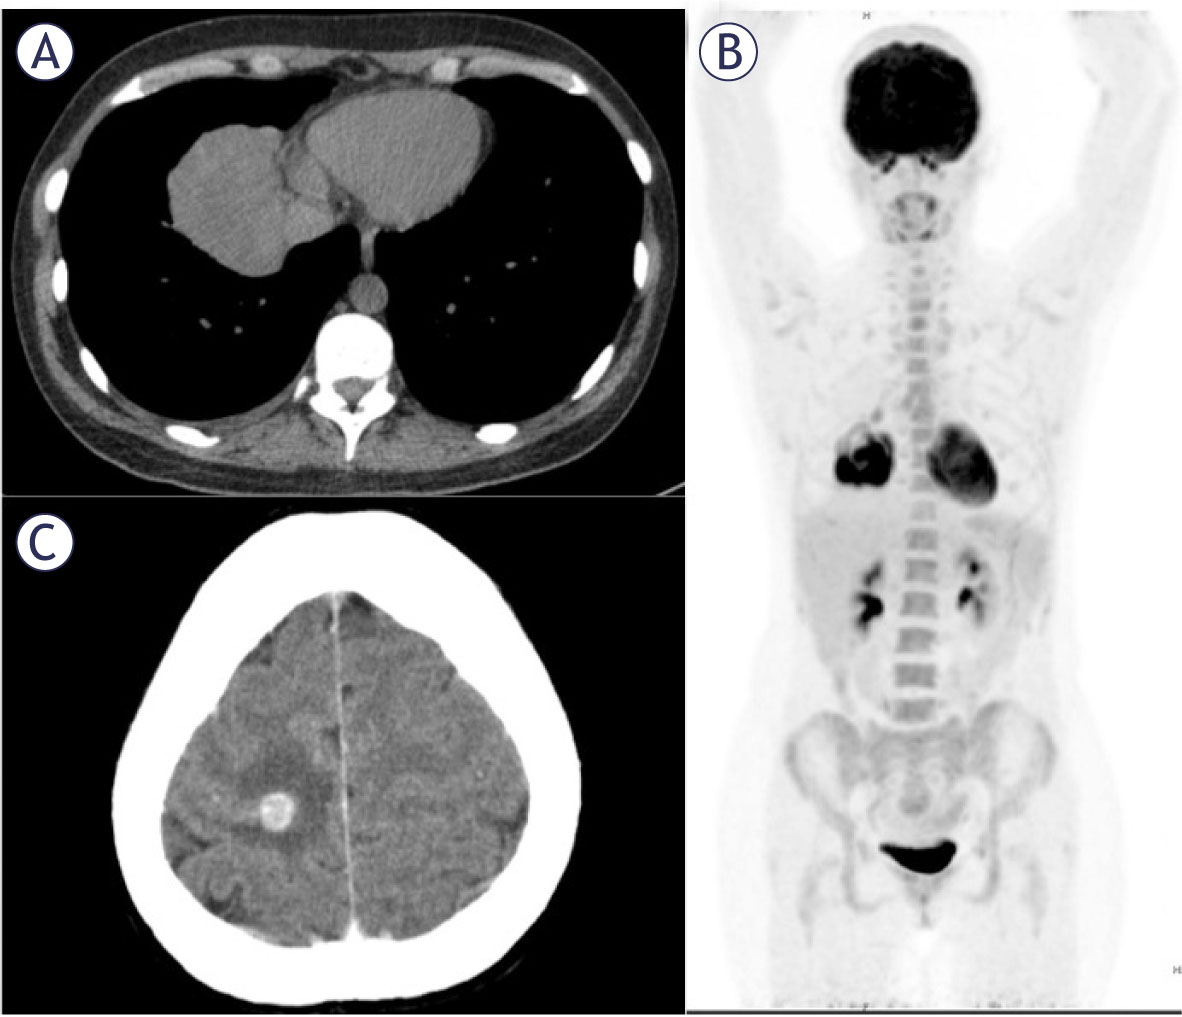
A computed tomographic scan of the chest showing 6.4 × 5.4 × 5.9 cm pulmonary mass in right lower lobe. (B) FDG-PET study showing FDG accumulation in the pulmonary mass in the right lower lobe with no other abnormal accumulation found in whole body including pelvic cavity. (C) CT of the head showing 1 cm intracerebral mass with surrounding oedema.
Table 1
Primary pulmonary choriocarcinoma: Summary of reported cases
| No of patients | 55 |
|---|---|
| Gender, male/female | 17/38 |
| Median age all patients, years | 34 |
| Median age female, years | 33 |
| Median age male, years | 60 |
| Initial symptom | |
| Cough | 22 |
| Dyspnea | 17 |
| Hemoptysis | 14 |
| Chest pain | 11 |
| Asymptomatic | 8 |
| Location | |
| Right / Left lung | 29/18 |
| Right upper lobe | 11 |
| Right middle lobe | 3 |
| Right lower lobe | 15 |
| Left upper lobe | 12 |
| Left lower lobe | 4 |
| Bilateral | 2 |
| Tumor size, cm | |
| ≤5 | 23 |
| > 5, ≤ 10 | 13 |
| > 10 | 8 |
| Treatment | |
| S | 10 |
| C | 8 |
| RT | 3 |
| S + C | 24 |
| S + C + RT | 3 |
C = chemotherapy; RT = radiotherapy; S = surgery
Table 2
Differences between female and male patients primary pulmonary choriocarcinoma
| Characteristics | Female | Male | p-value | |
|---|---|---|---|---|
| Age | < 40 | 30 | 4 | |
| ≥ 40 | 9 | 13 | 0.000 | |
| Size, cm | < 5 | 17 | 7 | |
| ≥ 5 | 12 | 8 | 0.162 | |
| Metastasis | Yes | 15 | 10 | |
| No | 24 | 7 | 0.161 | |
| Smoking | Yes | 2 | 9 | |
| No | 37 | 8 | 0.000 | |
| Hemoptysis | Yes | 13 | 5 | |
| No | 25 | 11 | 0.780 | |
| Treatment | ||||
| S | Yes | 24 | 9 | |
| No | 4 | 4 | 0.221 | |
| C | Yes | 21 | 10 | |
| No | 7 | 3 | 0.895 | |
| S+C | Yes | 17 | 7 | |
| No | 11 | 6 | 0.682 |
C = chemotherapy; S = surgey
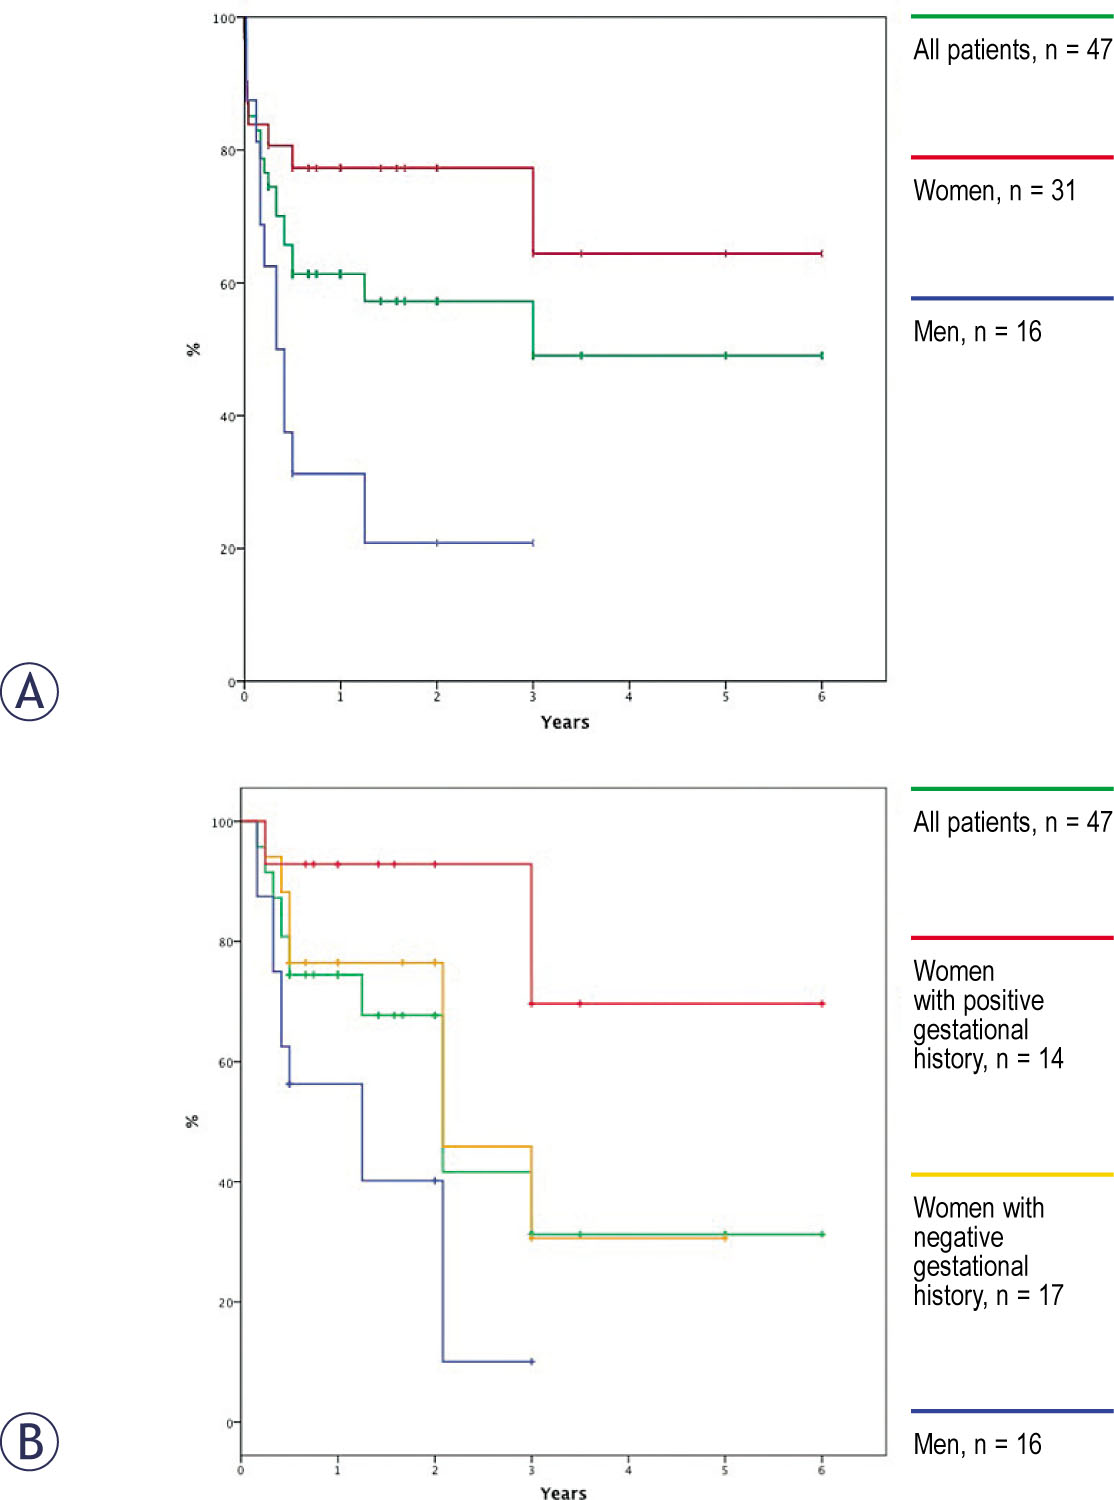
Kaplan-Meier survival curves. (A) Survival for all reported cases with curves showing survival for female patients was longer than for male patients (p = 0.004). (B) Survival of all reported cases with survival of men and curves showing survival of female patients with the history of gestational event was longer than for female patients without the history of gestational event (p = 0.040).
Table 3
Possible prognostic factors
| Characteristic | n | MST (months) | 1-year survival (%) | 2-year survival (%) | p-value | ||
|---|---|---|---|---|---|---|---|
| Gender | Female | 31 | - | 77.3 | 77.3 | ||
| Male | 16 | 4 | 31.3 | 20.8 | 0.004 | ||
| Age | < 40 | 29 | - | 75.9 | 58.4 | ||
| ≥ | 40 | 18 4 | 33.3 | 33.3 | 0.009 | ||
| Size (cm) | < 5 | 20 | - | 80.0 | 80.0 | ||
| ≥ 5 | 16 3 | 25.0 | 0.0 | 0.000 | |||
| Metastasis | Yes | 21 | 4 | 42.9 | 0.95 | ||
| No | 26 | - | 84.6 | 84.6 | 0.000 | ||
| Smoking | Yes | 11 4 | 0.0 | 0.0 | |||
| No | 36 | - | 69.4 | 69.4 | 0.001 | ||
| Female – gestational history | Positive | 14 | - | 69.6 | 69.6 | ||
| Negative | 16 | - | 56.3 | 56.3 | 0.040 | ||
| Treatment | |||||||
| S | Yes | 9 | - | 55.6 | 55.6 | ||
| No | 32 | - | 71.0 | 64.5 | 0.458 | ||
| C | Yes | 7 | 3 | 28.6 | 28.6 | ||
| No | 34 | - | 75.8 | 69.9 | 0.016 | ||
| S+C | Yes | 24 | - | 83.3 | 56.3 | ||
| No | 17 | 4 | 41.2 | 41.2 | 0.010 | ||
C = chemotherapy; MST = median survival time; S = surgery
Table 4
Multivariate analysis of prognostic factors, Cox proportional hazards model
| S+C | HR | 95% CI | p-value |
|---|---|---|---|
| Yes | 0.147 | 0.036 – 0.598 | 0.007 |
| No | 1 | ||
| Smoking | |||
| Yes | 1.827 | 0.418–7.982 | 0.423 |
| No | 1 | ||
| Gender | |||
| Male | 1.266 | 0.248–6.466 | 0.776 |
| Female | 1 | ||
| Tumour size, cm | |||
| ≥ 5 | 6.622 | 1.622–27.031 | 0.008 |
| < 5 | 1 | ||
| Age, years | |||
| ≥ 40 | 0.879 | 0.164–4.703 | 0.880 |
| < 40 | 1 |
C = chemotherapy; HR = hazard ratio; S = surgery