
Table 1
Some PET tracers used for imaging of epileptic focus and PET scan findings
| PET scan | Findings on PET scan |
|---|---|
| 18F-FDG interictal | Decreased metabolism |
| 18F-FDG ictal | Increased and decreased metabolism (complex pattern) |
| 18F-FDG postictal | Increased and decreased metabolism (complex pattern) |
| Serotonin receptor (e.g. 18F-Mefway) | Reduced binding |
| Dopamine receptor (e.g. 18F-Fallypride) | Reduced binding |
| 18F-Flumazenil (GABA receptor) | Decreased binding |
| 15O-H2O interictal | Reduced perfusion |
| 15O-H2O ictal | Increased perfusion |
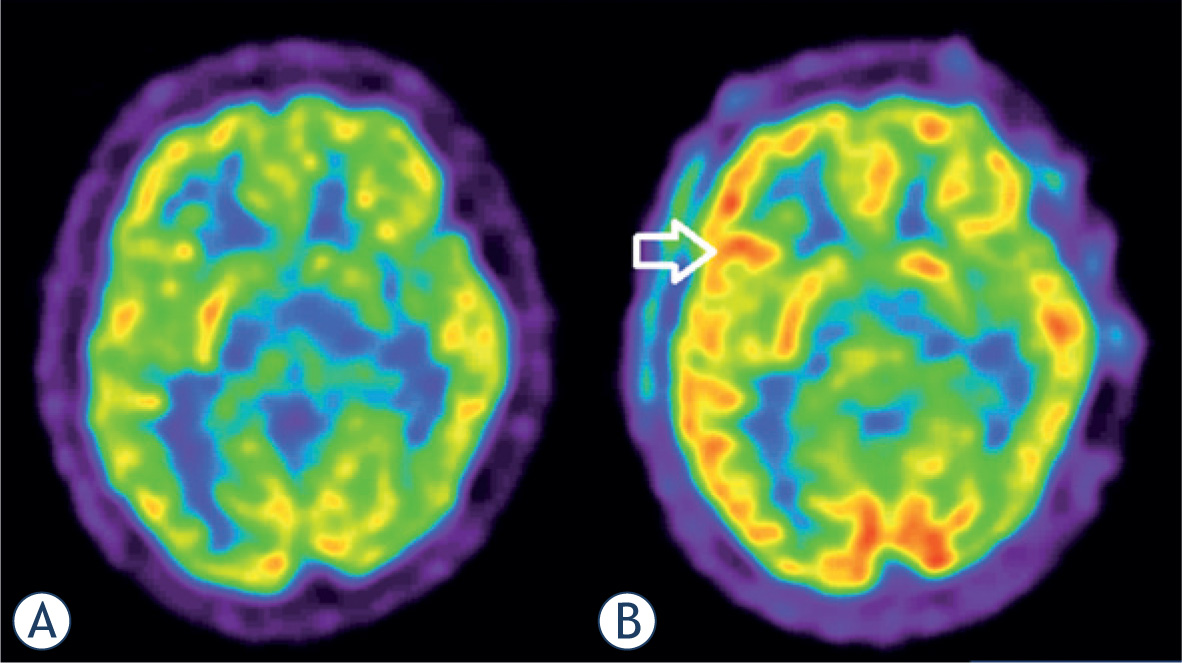
Figure 1
Focal epilepsy in 17 year old male patient. Interictal 18F-FDG PET (A): physiological distribution of 18F-FDG in the brain. Ictal 18F-FDG PET (B): hypermetabolism frontolateral in the right hemisphere (arrow).
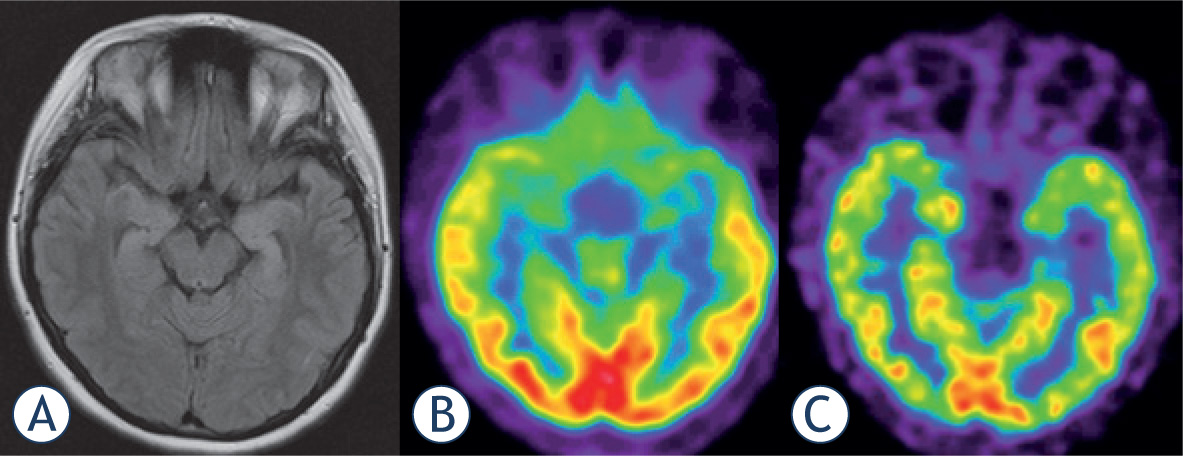
Figure 2
18F-FDG PET (B)scan vs. 18F-Flumazenil PET (C)in a 19 year old female patient with bilateral hippocampal sclerosis as shown by MRI (A). Both PET modalities present low temporomesial uptake being larger on the left side, but benzodiazepinereceptor imaging appears sharper and presents a focal defect.
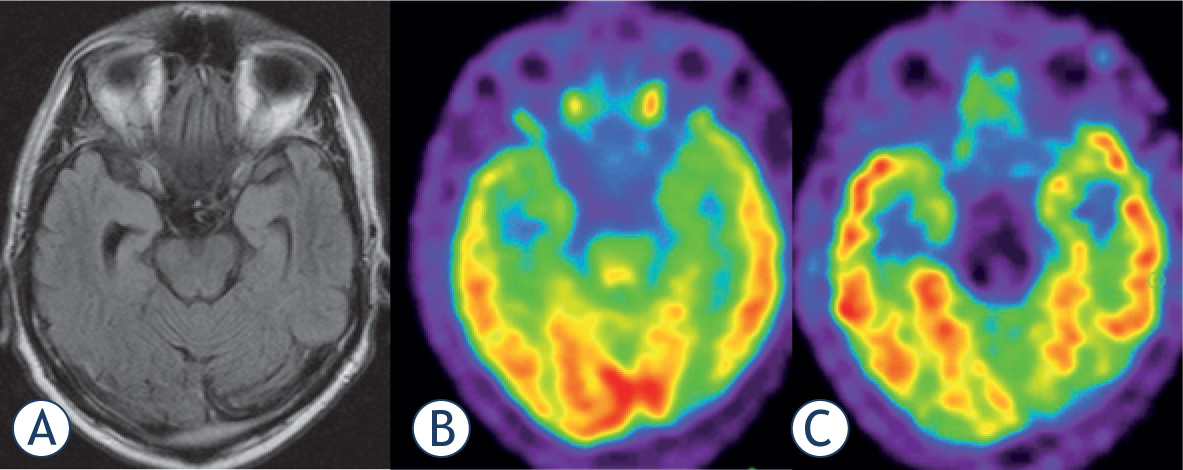
Figure 3
Focal epilepsy in 56 year old male patient. (A)MRI: astrogliosis of the right hippocampus (later proven by histology); (B)18F-FDG PET: minal temporomesial hypometabolism of both sides; (C)18F-Flumazenil PET: focal defect of tracer uptake at the right hippocampus.